1) Calculate the incidence rate/density of developing ADHD in the 2010-2011 school year using information from the schematic above. Please report the rate per 1000 student-years (10 months = 1 student year), using two decimal places. --> Using the first picture with the 2010 School Year (Sept-June) 2) Calculate the number of individuals still at risk after each school year ends and the annual incidence for each study year using the information in the table above. Use two decimal points for your incidence calculation. Fill in the table above where there are question marks, but be sure to show your work below. (Hint: Think carefully about the denominator and the timing of being at-risk --> second picture Thank you so much for the help! Any work shown to understand each step would be appreciated!

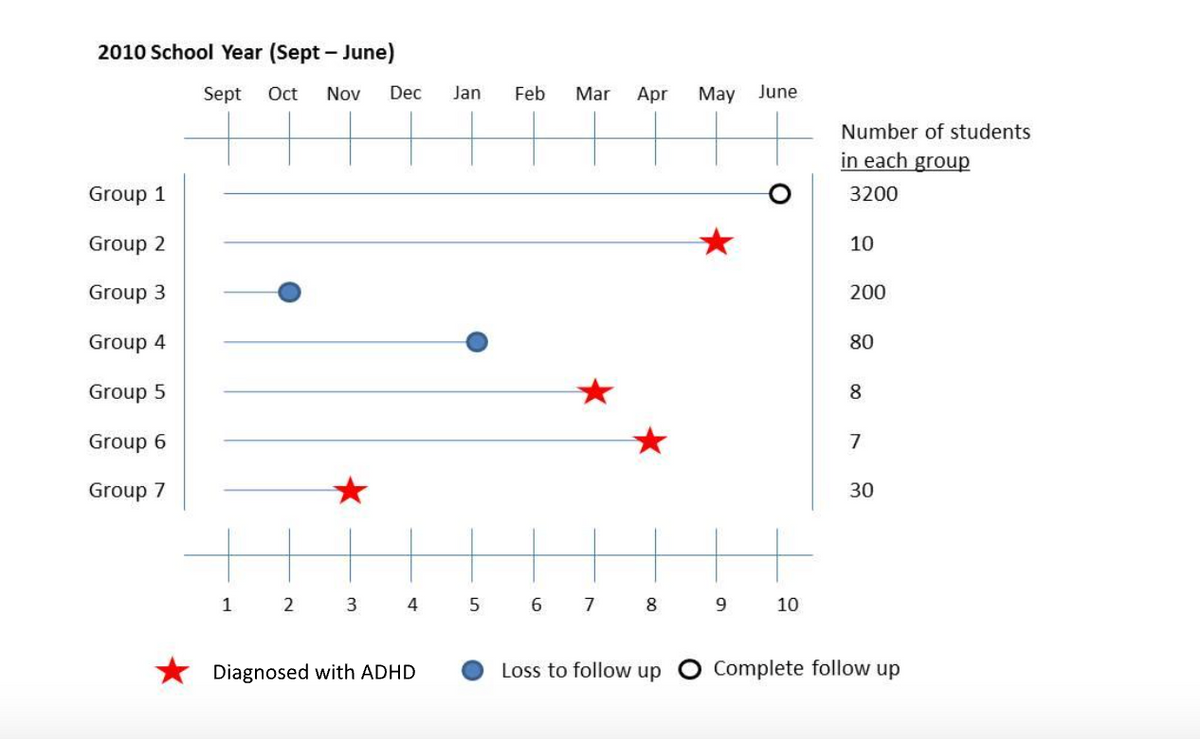
1) Calculate the incidence rate/density of developing ADHD in the 2010-2011 school year using information from the schematic above. Please report the rate per 1000 student-years (10 months = 1 student year), using two decimal places. --> Using the first picture with the 2010 School Year (Sept-June)
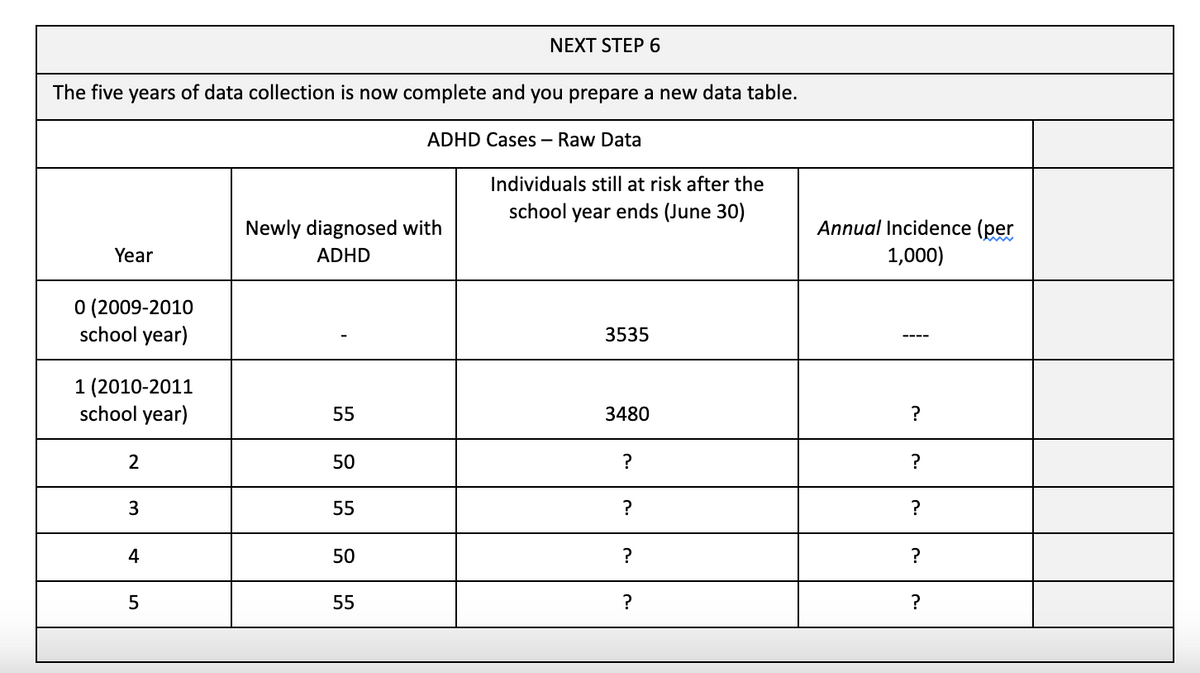
2) Calculate the number of individuals still at risk after each school year ends and the annual incidence for each study year using the information in the table above. Use two decimal points for your incidence calculation. Fill in the table above where there are question marks, but be sure to show your work below. (Hint: Think carefully about the denominator and the timing of being at-risk --> second picture
Thank you so much for the help! Any work shown to understand each step would be appreciated!


Trending now
This is a popular solution!

Step by step
Solved in 4 steps
