
An Introduction to Physical Science
14th Edition
ISBN:9781305079137
Author:James Shipman, Jerry D. Wilson, Charles A. Higgins, Omar Torres
Publisher:James Shipman, Jerry D. Wilson, Charles A. Higgins, Omar Torres
Chapter1: Measurement
Section: Chapter Questions
Problem 15E

Related questions

Question
In the picture below you can see two methods a wind direction is measured. The first method (method A) designates the direction of a wind by specifying the angle at which it blows measured anticlockwise from the East. In contrast, the second method (method B) indicates the angle from which the wind is blowing, measured clockwise from the North. Both methods utilise values within the range of 0° to 360°. i) Derive a piecewise formula expressing thitaA in terms of thita_pi - ii) Draw a graph depicting the angle thitaA as a function of the angle thita/bar (B).
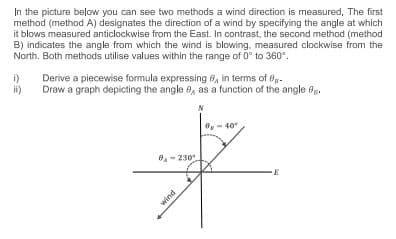
Transcribed Image Text:In the picture below you can see two methods a wind direction is measured. The first
method (method A) designates the direction of a wind by specifying the angle at which
it blows measured anticlockwise from the East. In contrast, the second method (method
B) indicates the angle from which the wind is blowing, measured clockwise from the
North. Both methods utilise values within the range of 0° to 360°.
Derive a piecewise formula expressing 8, in terms of 0-
1)
ii)
Draw a graph depicting the angle e, as a function of the angle 0.
0-230
wind
40°
E
Expert Solution
This question has been solved!
Explore an expertly crafted, step-by-step solution for a thorough understanding of key concepts.

This is a popular solution!

Trending now
This is a popular solution!

Step by step
Solved in 4 steps with 4 images

Knowledge Booster


Learn more about
Need a deep-dive on the concept behind this application? Look no further. Learn more about this topic, physics and related others by exploring similar questions and additional content below.Recommended textbooks for you
An Introduction to Physical Science
Physics
ISBN:
9781305079137
Author:
James Shipman, Jerry D. Wilson, Charles A. Higgins, Omar Torres
Publisher:
Cengage Learning
An Introduction to Physical Science
Physics
ISBN:
9781305079137
Author:
James Shipman, Jerry D. Wilson, Charles A. Higgins, Omar Torres
Publisher:
Cengage Learning