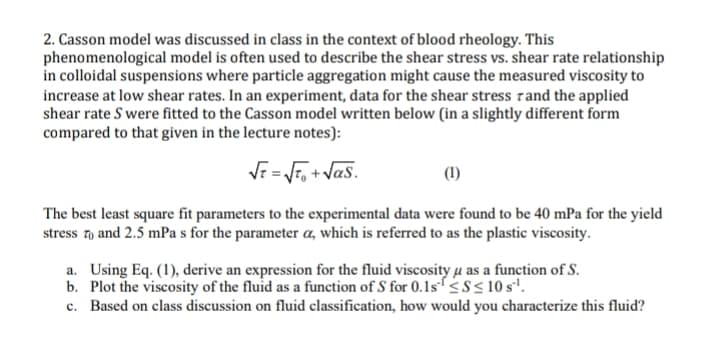
2. Casson model was discussed in class in the context of blood rheology. This phenomenological model is often used to describe the shear stress vs. shear rate relationship in colloidal suspensions where particle aggregation might cause the measured viscosity to increase at low shear rates. In an experiment, data for the shear stress rand the applied shear rate S were fitted to the Casson model written below (in a slightly different form compared to that given in the lecture notes): √r = √T₁+√as. (1) The best least square fit parameters to the experimental data were found to be 40 mPa for the yield stress to and 2.5 mPas for the parameter a, which is referred to as the plastic viscosity. a. Using Eq. (1), derive an expression for the fluid viscosity u as a function of S. b. Plot the viscosity of the fluid as a function of S for 0.1s¹ ≤S≤ 10 s¹. c. Based on class discussion on fluid classification, how would you characterize this fluid?
2. Casson model was discussed in class in the context of blood rheology. This phenomenological model is often used to describe the shear stress vs. shear rate relationship in colloidal suspensions where particle aggregation might cause the measured viscosity to increase at low shear rates. In an experiment, data for the shear stress rand the applied shear rate S were fitted to the Casson model written below (in a slightly different form compared to that given in the lecture notes): √r = √T₁+√as. (1) The best least square fit parameters to the experimental data were found to be 40 mPa for the yield stress to and 2.5 mPas for the parameter a, which is referred to as the plastic viscosity. a. Using Eq. (1), derive an expression for the fluid viscosity u as a function of S. b. Plot the viscosity of the fluid as a function of S for 0.1s¹ ≤S≤ 10 s¹. c. Based on class discussion on fluid classification, how would you characterize this fluid?
Principles of Heat Transfer (Activate Learning with these NEW titles from Engineering!)
8th Edition
ISBN:9781305387102
Author:Kreith, Frank; Manglik, Raj M.
Publisher:Kreith, Frank; Manglik, Raj M.
Chapter5: Analysis Of Convection Heat Transfer
Section: Chapter Questions
Problem 5.8P
Related questions
Question

Transcribed Image Text:2. Casson model was discussed in class in the context of blood rheology. This
phenomenological model is often used to describe the shear stress vs. shear rate relationship
in colloidal suspensions where particle aggregation might cause the measured viscosity to
increase at low shear rates. In an experiment, data for the shear stress and the applied
shear rate S were fitted to the Casson model written below (in a slightly different form
compared to that given in the lecture notes):
√t = √²₁+√as.
(1)
The best least square fit parameters to the experimental data were found to be 40 mPa for the yield
stress to and 2.5 mPa s for the parameter a, which is referred to as the plastic viscosity.
a. Using Eq. (1), derive an expression for the fluid viscosity u as a function of S.
b. Plot the viscosity of the fluid as a function of S for 0.1s¹ ≤S≤ 10 s¹.
c. Based on class discussion on fluid classification, how would you characterize this fluid?
Expert Solution
This question has been solved!
Explore an expertly crafted, step-by-step solution for a thorough understanding of key concepts.
Step by step
Solved in 3 steps with 4 images

Knowledge Booster
Learn more about
Need a deep-dive on the concept behind this application? Look no further. Learn more about this topic, mechanical-engineering and related others by exploring similar questions and additional content below.Recommended textbooks for you

Principles of Heat Transfer (Activate Learning wi…
Mechanical Engineering
ISBN:
9781305387102
Author:
Kreith, Frank; Manglik, Raj M.
Publisher:
Cengage Learning

Principles of Heat Transfer (Activate Learning wi…
Mechanical Engineering
ISBN:
9781305387102
Author:
Kreith, Frank; Manglik, Raj M.
Publisher:
Cengage Learning