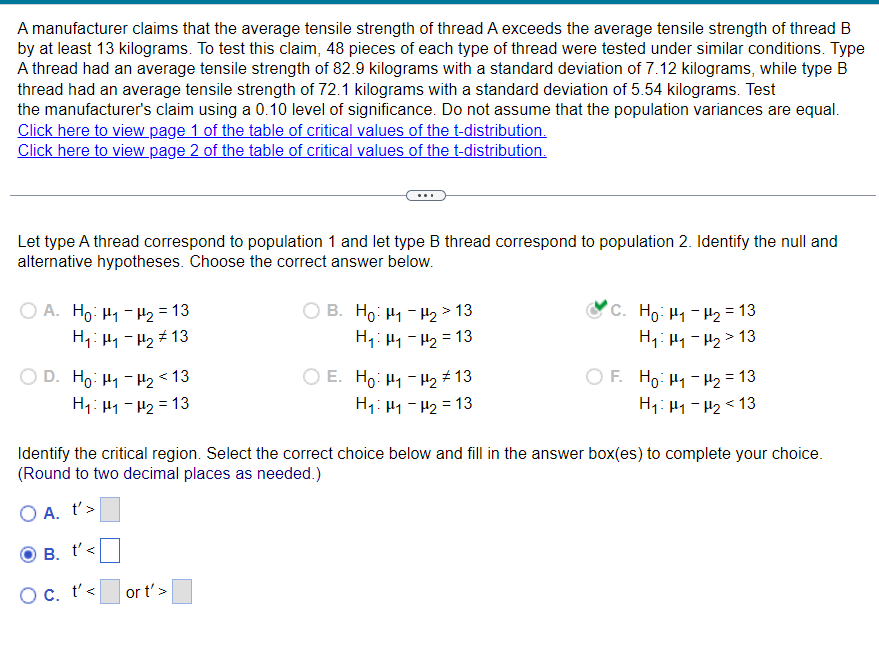
A manufacturer claims that the average tensile strength of thread A exceeds the average tensile strength of thread B by at least 13 kilograms. To test this claim, 48 pieces of each type of thread were tested under similar conditions. Type A thread had an average tensile strength of 82.9 kilograms with a standard deviation of 7.12 kilograms, while type B thread had an average tensile strength of 72.1 kilograms with a standard deviation of 5.54 kilograms. Test the manufacturer's claim using a 0.10 level of significance. Do not assume that the population variances are equal. Click here to view page 1 of the table of critical values of the t-distribution. Click here to view page 2 of the table of critical values of the t-distribution. Let type A thread correspond to population 1 and let type B thread correspond to population 2. Identify the null and alternative hypotheses. Choose the correct answer below. OA. Ho H1 H2 = 13 H₁: H1-H213 OB. Ho H1 H2> 13 H₁: H1 H2 13 C. Ho HH2 =13 H₁: H1 H213 OD. Ho H1 H2 <13 H1 H1-H2=13 OE. Ho H1 H2 #13 H₁: H1-H2=13 OF. Ho H1 H2 = 13 H1 H1 H2 13 Identify the critical region. Select the correct choice below and fill in the answer box(es) to complete your choice. (Round to two decimal places as needed.) O A. t'> B. O c. t'< t' < <☐ or t'>
A manufacturer claims that the average tensile strength of thread A exceeds the average tensile strength of thread B by at least 13 kilograms. To test this claim, 48 pieces of each type of thread were tested under similar conditions. Type A thread had an average tensile strength of 82.9 kilograms with a standard deviation of 7.12 kilograms, while type B thread had an average tensile strength of 72.1 kilograms with a standard deviation of 5.54 kilograms. Test the manufacturer's claim using a 0.10 level of significance. Do not assume that the population variances are equal. Click here to view page 1 of the table of critical values of the t-distribution. Click here to view page 2 of the table of critical values of the t-distribution. Let type A thread correspond to population 1 and let type B thread correspond to population 2. Identify the null and alternative hypotheses. Choose the correct answer below. OA. Ho H1 H2 = 13 H₁: H1-H213 OB. Ho H1 H2> 13 H₁: H1 H2 13 C. Ho HH2 =13 H₁: H1 H213 OD. Ho H1 H2 <13 H1 H1-H2=13 OE. Ho H1 H2 #13 H₁: H1-H2=13 OF. Ho H1 H2 = 13 H1 H1 H2 13 Identify the critical region. Select the correct choice below and fill in the answer box(es) to complete your choice. (Round to two decimal places as needed.) O A. t'> B. O c. t'< t' < <☐ or t'>

MATLAB: An Introduction with Applications
6th Edition
ISBN:9781119256830
Author:Amos Gilat
Publisher:Amos Gilat
Chapter1: Starting With Matlab
Section: Chapter Questions
Problem 1P

Related questions
Question
100%
I need help with this last part
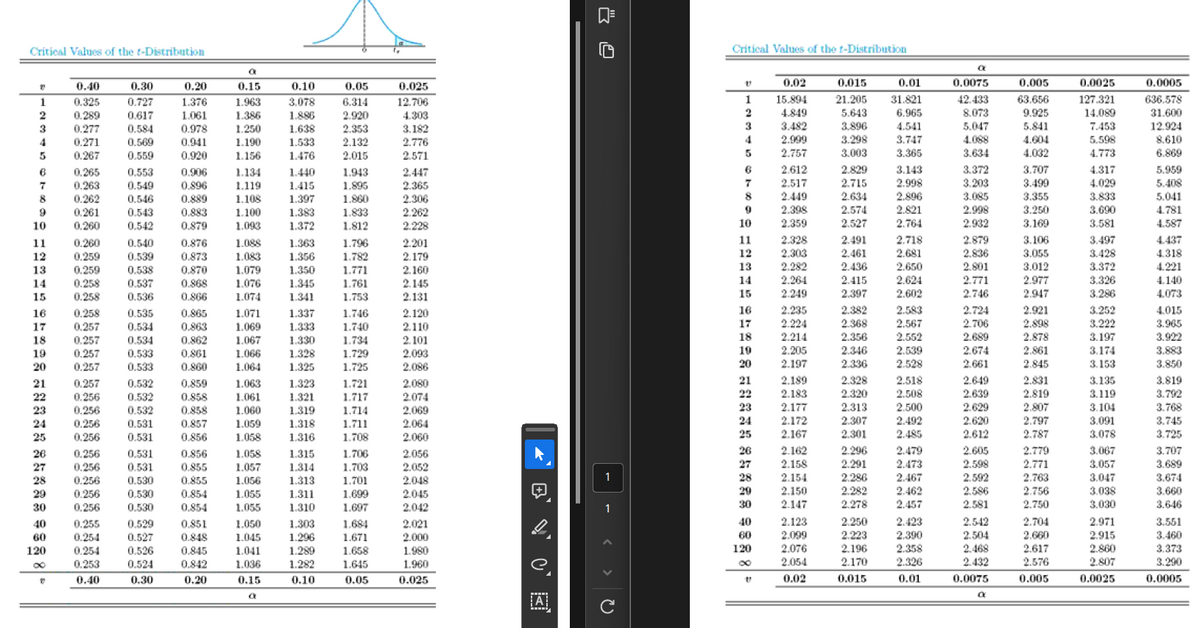
Transcribed Image Text:Critical Values of the t-Distribution
Critical Values of the t-Distribution
a
a
0.40
0.30
0.20
0.15
0.10
0.05
0.025
0.02
0.015
0.01
0.0075
0.005
0.0025
0.0005
1
0.325
0.727
1.376
1.963
3.078
6.314
12.706
1
15.894
21.205
31.821
42.433
63.656
127.321
636.578
2
0.289
0.617
1.061
1.386
1.886
2.920
4.303
2
4.849
5.643
6.965
8.073
9.925
14.089
31.600
3
0.277
0.584
0.978
1.250
1.638
2.353
3.182
3
3.482
3.896
4.541
5.047
5.841
7.453
12.924
4
0.271
0.569
0.941
1.190
1.533
2.132
2.776
4
2.999
3.298
3.747
4.088
4.604
5.598
8.610
5
0.267
0.559
0.920
1.156
1.476
2.015
2.571
5
2.757
3.003
3.365
3.634
4.032
4.773
6.869
в
0.265
0.553
0.906
1.134
1.440
1.943
2.447
6
2.612
2.829
3.143
3.372
3.707
4.317
5.959
7
0.263
0.549
0.896
1.119
1.415
1.895
2.365
7
2.517
2.715
2.998
3.203
3.499
4.029
5.408
8
0.262
0.546
0.889
1.108
1.397
1.860
2.306
8
2.449
2.634
2.896
3.085
3.355
3.833
5.041
9
0.261
0.543
0.883
1.100
1.383
1.833
2.262
9
2.398
2.574
2.821
2.998
3.250
3.690
4.781
10
0.260
0.542
0.879
1.093
1.372
1.812
2.228
10
2.359
2.527
2.764
2.932
3.169
3.581
4.587
11
0.260
0.540
0.876
1.088
1.363
1.796
2.201
11
2.328
2.491
2.718
2.879
3.106
3.497
4.437
12
0.259
0.539
0.873
1.083
1.356
1.782
2.179
12
2.303
2.461
2.681
2.836
3.055
3.428
4.318
13
0.259
0.538
0.870
1.079
1.350
1.771
2.160
13
2.282
2.436
2.650
2.801
3.012
3.372
4.221
14
0.258
0.537
0.868
1.076
1.345
1.761
2.145
14
2.264
2.415
2.624
2.771
2.977
3.326
4.140
15
0.258
0.536
0.866
1.074
1.341
1.753
2.131
15
2.249
2.397
2.602
2.746
2.947
3.286
4.073
16
0.258
0.535
0.865
1.071
1.337
1.746
2.120
16
2.235
2.382
2.583
2.724
2.921
3.252
4.015
17
0.257
0.534
0.863
1.069
1.333
1.740
2.110
17
2.224
2.368
2.567
2.706
2.898
3.222
3.965
18
0.257
0.534
0.862
1.067
1.330
1.734
2.101
18
2.214
2.356
2.552
2.689
2.878
3.197
3.922
19
0.257
0.533
0.861
1.066
1.328
1.729
2.093
2.205
2.346
2.539
2.674
2.861
3.174
3.883
20
0.257
0.533
0.860
1.064
1.325
1.725
2.086
20
2.197
2.336
2.528
2.661
2.845
3.153
3.850
21
0.257
0.532
0.859
1.063
1.323
1.721
2.080
21
2.189
2.328
2.518
2.649
2.831
3.135
3.819
22
0.256
0.532
0.858
1.061
1.321
1.717
2.074
22
2.183
2.320
2.508
2.639
2.819
3.119
3.792
23
0.256
0.532
0.858
1.060
1.319
1.714
2.069
23
2.177
2.313
2.500
2.629
2.807
3.104
3.768
24
0.256
0.531
0.857
1.059
1.318
1.711
2.064
24
2.172
2.307
2.492
2.620
2.797
3.091
3.745
25
0.256
0.531
0.856
1.058
1.316
1.708
2.060
25
2.167
2.301
2.485
2.612
2.787
3.078
3.725
26
0.256
0.531
0.856
1.058
1.315
1.706
2.056
27
0.256
0.531
0.855
1.057
1.314
1.703
2.052
28
0.256
0.530
0.855
1.056
1.313
1.701
2.048
-
29
0.256
0.530
0.854
1.055
1.311
1.699
2.045
30
0.256
0.530
0.854
1.055
1.310
1.697
2.042
40
0.255
0.529
0.851
1.050
1.303
1.684
2.021
60
0.254
0.527
0.848
1.045
1.296
1.671
2.000
120
0.254
0.526
0.845
1.041
1.289
1.658
1.980
8"
0.253
0.524
0.842
1.036
1.282
1.645
1.960
e
0.40
0.30
0.20
0.15
0.10
- <>
120
888 988
26
2.162
2.296
2.479
2.605
2.779
3.067
3.707
27
2.158
2.291
2.473
2.598
2.771
3.057
3.689
28
2.154
2.286
2.467
2.592
2.763
3.047
3.674
2.150
2.282
2.462
2.586
2.756
3.038
3.660
30
2.147
2.278
2.457
2.581
2.750
3.030
3.646
40
2.123
2.250
2.423
2.542
2.704
2.971
3.551
60
2.099
2.223
2.390
2.504
2.660
2.915
3.460
2.076
2.196
2.358
2.468
2.617
2.860
3.373
2.054
2.170
2.326
2.432
2.576
2.807
3.290
0.05
0.025
0.02
0.015
0.01
0.0075
0.005
0.0025
0.0005
a
A
a
C
Transcribed Image Text:A manufacturer claims that the average tensile strength of thread A exceeds the average tensile strength of thread B
by at least 13 kilograms. To test this claim, 48 pieces of each type of thread were tested under similar conditions. Type
A thread had an average tensile strength of 82.9 kilograms with a standard deviation of 7.12 kilograms, while type B
thread had an average tensile strength of 72.1 kilograms with a standard deviation of 5.54 kilograms. Test
the manufacturer's claim using a 0.10 level of significance. Do not assume that the population variances are equal.
Click here to view page 1 of the table of critical values of the t-distribution.
Click here to view page 2 of the table of critical values of the t-distribution.
Let type A thread correspond to population 1 and let type B thread correspond to population 2. Identify the null and
alternative hypotheses. Choose the correct answer below.
OA. Ho H1 H2 = 13
H₁: H1-H213
OD. Ho H1-H2 <13
H1 H1 H2 13
B. Ho₁₂>13
H₁₁₂ = 13
C. Ho. H-H2 =13
H₁₁₂>13
E. Ho: H1-H2 13
H₁: H1-H2=13
OF. Ho H1 H2 = 13
H₁: H1-H2 <13
Identify the critical region. Select the correct choice below and fill in the answer box(es) to complete your choice.
(Round to two decimal places as needed.)
O A. t'>
B.
Oc. t'<
t' <
or t'>
Expert Solution
This question has been solved!
Explore an expertly crafted, step-by-step solution for a thorough understanding of key concepts.

Step by step
Solved in 3 steps with 6 images

Recommended textbooks for you
MATLAB: An Introduction with Applications
Statistics
ISBN:
9781119256830
Author:
Amos Gilat
Publisher:
John Wiley & Sons Inc

Probability and Statistics for Engineering and th…
Statistics
ISBN:
9781305251809
Author:
Jay L. Devore
Publisher:
Cengage Learning

Statistics for The Behavioral Sciences (MindTap C…
Statistics
ISBN:
9781305504912
Author:
Frederick J Gravetter, Larry B. Wallnau
Publisher:
Cengage Learning
MATLAB: An Introduction with Applications
Statistics
ISBN:
9781119256830
Author:
Amos Gilat
Publisher:
John Wiley & Sons Inc
Probability and Statistics for Engineering and th…
Statistics
ISBN:
9781305251809
Author:
Jay L. Devore
Publisher:
Cengage Learning
Statistics for The Behavioral Sciences (MindTap C…
Statistics
ISBN:
9781305504912
Author:
Frederick J Gravetter, Larry B. Wallnau
Publisher:
Cengage Learning

Elementary Statistics: Picturing the World (7th E…
Statistics
ISBN:
9780134683416
Author:
Ron Larson, Betsy Farber
Publisher:
PEARSON

The Basic Practice of Statistics
Statistics
ISBN:
9781319042578
Author:
David S. Moore, William I. Notz, Michael A. Fligner
Publisher:
W. H. Freeman

Introduction to the Practice of Statistics
Statistics
ISBN:
9781319013387
Author:
David S. Moore, George P. McCabe, Bruce A. Craig
Publisher:
W. H. Freeman