A polling organization polls n = 400 randomly selected registered voters to estimate the proportion of a large population that intends to vote for Candidate Y in an upcoming election. Although it is not known by the polling organization, p = 0.7 is the actual proportion of the population that prefers Candidate Y. (a) Give the numerical value of the mean of the sampling distribution of p. Mean = (b) Calculate the standard deviation, s.d., of the sampling distribution of p. (Round your answer to the nearest hundredth.) s.d. = (c) Use the Empirical Rule to find values that fill in the blanks in the following sentence. (Round all answers to the nearest hundredth.) In about 99.7% of all randomly selected samples of n = 400 from this population, the sample proportion preferring Candidate Y will be between and
A polling organization polls n = 400 randomly selected registered voters to estimate the proportion of a large population that intends to vote for Candidate Y in an upcoming election. Although it is not known by the polling organization, p = 0.7 is the actual proportion of the population that prefers Candidate Y. (a) Give the numerical value of the mean of the sampling distribution of p. Mean = (b) Calculate the standard deviation, s.d., of the sampling distribution of p. (Round your answer to the nearest hundredth.) s.d. = (c) Use the Empirical Rule to find values that fill in the blanks in the following sentence. (Round all answers to the nearest hundredth.) In about 99.7% of all randomly selected samples of n = 400 from this population, the sample proportion preferring Candidate Y will be between and

MATLAB: An Introduction with Applications
6th Edition
ISBN:9781119256830
Author:Amos Gilat
Publisher:Amos Gilat
Chapter1: Starting With Matlab
Section: Chapter Questions
Problem 1P

Related questions
Question
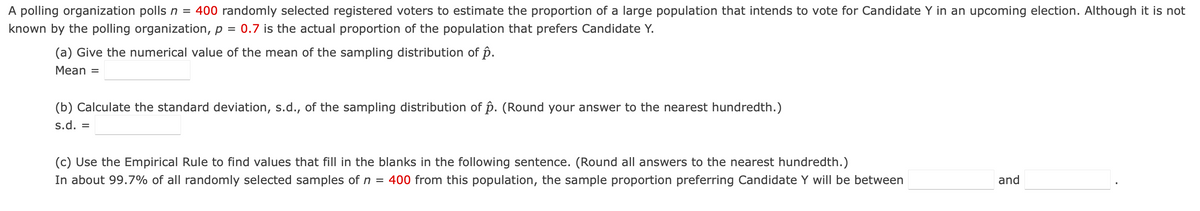
Transcribed Image Text:A polling organization polls n = 400 randomly selected registered voters to estimate the proportion of a large population that intends to vote for Candidate Y in an upcoming election. Although it is not
known by the polling organization, p = 0.7 is the actual proportion of the population that prefers Candidate Y.
(a) Give the numerical value of the mean of the sampling distribution of p.
Mean =
(b) Calculate the standard deviation, s.d., of the sampling distribution of p. (Round your answer to the nearest hundredth.)
s.d. =
(c) Use the Empirical Rule to find values that fill in the blanks in the following sentence. (Round all answers to the nearest hundredth.)
In about 99.7% of all randomly selected samples of n = 400 from this population, the sample proportion preferring Candidate Y will be between
and
AI-Generated Solution

Unlock instant AI solutions
Tap the button
to generate a solution
Recommended textbooks for you
MATLAB: An Introduction with Applications
Statistics
ISBN:
9781119256830
Author:
Amos Gilat
Publisher:
John Wiley & Sons Inc

Probability and Statistics for Engineering and th…
Statistics
ISBN:
9781305251809
Author:
Jay L. Devore
Publisher:
Cengage Learning

Statistics for The Behavioral Sciences (MindTap C…
Statistics
ISBN:
9781305504912
Author:
Frederick J Gravetter, Larry B. Wallnau
Publisher:
Cengage Learning
MATLAB: An Introduction with Applications
Statistics
ISBN:
9781119256830
Author:
Amos Gilat
Publisher:
John Wiley & Sons Inc
Probability and Statistics for Engineering and th…
Statistics
ISBN:
9781305251809
Author:
Jay L. Devore
Publisher:
Cengage Learning
Statistics for The Behavioral Sciences (MindTap C…
Statistics
ISBN:
9781305504912
Author:
Frederick J Gravetter, Larry B. Wallnau
Publisher:
Cengage Learning

Elementary Statistics: Picturing the World (7th E…
Statistics
ISBN:
9780134683416
Author:
Ron Larson, Betsy Farber
Publisher:
PEARSON

The Basic Practice of Statistics
Statistics
ISBN:
9781319042578
Author:
David S. Moore, William I. Notz, Michael A. Fligner
Publisher:
W. H. Freeman

Introduction to the Practice of Statistics
Statistics
ISBN:
9781319013387
Author:
David S. Moore, George P. McCabe, Bruce A. Craig
Publisher:
W. H. Freeman