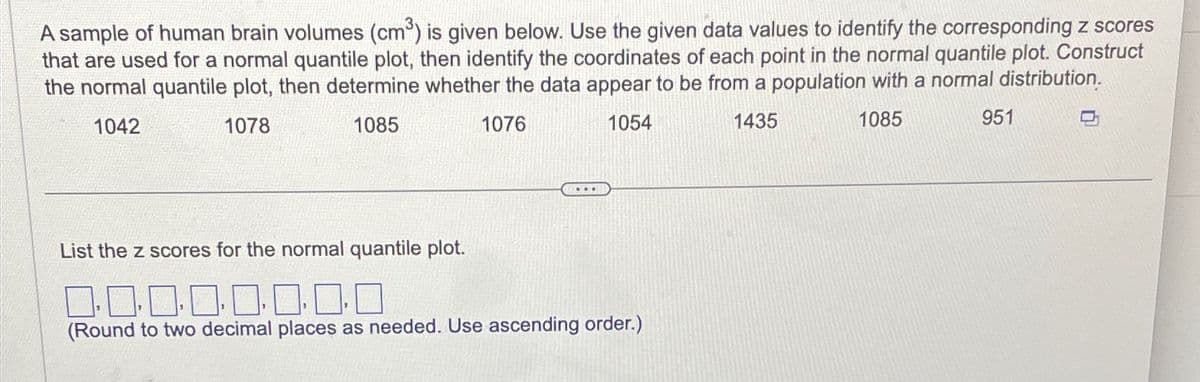
A sample of human brain volumes (cm³) is given below. Use the given data values to identify the corresponding z scores that are used for a normal quantile plot, then identify the coordinates of each point in the normal quantile plot. Construct the normal quantile plot, then determine whether the data appear to be from a population with a normal distribution. 1042 1078 1085 1076 1054 1435 1085 951
A sample of human brain volumes (cm³) is given below. Use the given data values to identify the corresponding z scores that are used for a normal quantile plot, then identify the coordinates of each point in the normal quantile plot. Construct the normal quantile plot, then determine whether the data appear to be from a population with a normal distribution. 1042 1078 1085 1076 1054 1435 1085 951

Glencoe Algebra 1, Student Edition, 9780079039897, 0079039898, 2018
18th Edition
ISBN:9780079039897
Author:Carter
Publisher:Carter
Chapter10: Statistics
Section10.3: Measures Of Spread
Problem 26PFA

Related questions
Question
Transcribed Image Text:A sample of human brain volumes (cm³) is given below. Use the given data values to identify the corresponding z scores
that are used for a normal quantile plot, then identify the coordinates of each point in the normal quantile plot. Construct
the normal quantile plot, then determine whether the data appear to be from a population with a normal distribution.
1042
1078
1085
1076
1054
List the z scores for the normal quantile plot.
1.1.1.1.1.1.
(Round to two decimal places as needed. Use ascending order.)
1435
1085
951
Expert Solution
This question has been solved!
Explore an expertly crafted, step-by-step solution for a thorough understanding of key concepts.

Step by step
Solved in 3 steps with 6 images

Recommended textbooks for you
Glencoe Algebra 1, Student Edition, 9780079039897…
Algebra
ISBN:
9780079039897
Author:
Carter
Publisher:
McGraw Hill
Glencoe Algebra 1, Student Edition, 9780079039897…
Algebra
ISBN:
9780079039897
Author:
Carter
Publisher:
McGraw Hill