According to the manufacturer of M&Ms, 13% of the plain M&Ms in a bag should be brown, 14% yellow, 13% red, 24% blue, 20% orange, and 16% green. A student randomly selected a bag of plain M counted the number of M&Ms of each color and obtained the results shown in the table. Test whether plain M&Ms follow the distribution stated by the manufacturer at the a=0.05 level of significance. Determine the null and alternative hypotheses. Choose the correct answer below. OA. Ho The distribution of colors is not the same as stated by the manufacturer. H₁ The distribution of colors is the same as stated by the manufacturer. OB. Ho The distribution of colors is the same as stated by the manufacturer. H₁ The distribution of colors is not the same as stated by the manufacturer. OC. Ho The distribution of colors is at least as uniform as stated by the manufacturer. H₁ The distribution of colors is less uniform than stated by the manufacturer. O D. Ho. The distribution of colors is at most as uniform as stated by the manufacturer. H₁ The distribution of colors is more uniform than stated by the manufacturer. Compute the expected counts for each color. (Round to two decimal places as needed.) Color Brown Yellow Red Frequency 61 65 56 Expected Count Observed Distribution of Colors Color Frequency Claimed Proportion Brown Yellow 61 65 0.13 0.14 Print Red 56 0.13 Done Blue Orange Green 62 95 66 0.24 0.20 0.16 O
According to the manufacturer of M&Ms, 13% of the plain M&Ms in a bag should be brown, 14% yellow, 13% red, 24% blue, 20% orange, and 16% green. A student randomly selected a bag of plain M counted the number of M&Ms of each color and obtained the results shown in the table. Test whether plain M&Ms follow the distribution stated by the manufacturer at the a=0.05 level of significance. Determine the null and alternative hypotheses. Choose the correct answer below. OA. Ho The distribution of colors is not the same as stated by the manufacturer. H₁ The distribution of colors is the same as stated by the manufacturer. OB. Ho The distribution of colors is the same as stated by the manufacturer. H₁ The distribution of colors is not the same as stated by the manufacturer. OC. Ho The distribution of colors is at least as uniform as stated by the manufacturer. H₁ The distribution of colors is less uniform than stated by the manufacturer. O D. Ho. The distribution of colors is at most as uniform as stated by the manufacturer. H₁ The distribution of colors is more uniform than stated by the manufacturer. Compute the expected counts for each color. (Round to two decimal places as needed.) Color Brown Yellow Red Frequency 61 65 56 Expected Count Observed Distribution of Colors Color Frequency Claimed Proportion Brown Yellow 61 65 0.13 0.14 Print Red 56 0.13 Done Blue Orange Green 62 95 66 0.24 0.20 0.16 O

Glencoe Algebra 1, Student Edition, 9780079039897, 0079039898, 2018
18th Edition
ISBN:9780079039897
Author:Carter
Publisher:Carter
Chapter10: Statistics
Section10.6: Summarizing Categorical Data
Problem 10CYU

Related questions
Question
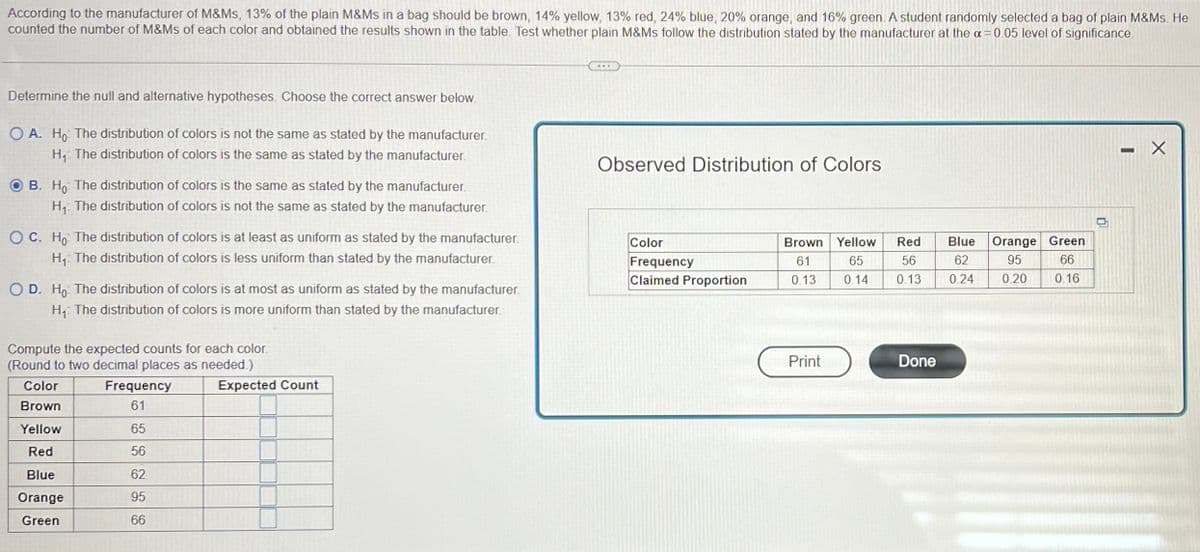
Transcribed Image Text:According to the manufacturer of M&Ms, 13% of the plain M&Ms in a bag should be brown, 14% yellow, 13% red, 24% blue, 20% orange, and 16% green. A student randomly selected a bag of plain M&Ms. He
counted the number of M&Ms of each color and obtained the results shown in the table. Test whether plain M&Ms follow the distribution stated by the manufacturer at the x = 0.05 level of significance.
Determine the null and alternative hypotheses. Choose the correct answer below.
O A. Ho The distribution of colors is not the same as stated by the manufacturer.
H₁ The distribution of colors is the same as stated by the manufacturer.
B. Ho The distribution of colors is the same as stated by the manufacturer.
H₁: The distribution of colors is not the same as stated by the manufacturer.
O C. Ho The distribution of colors is at least as uniform as stated by the manufacturer.
H₁: The distribution of colors is less uniform than stated by the manufacturer.
O D. Ho The distribution of colors is at most as uniform as stated by the manufacturer.
H₁: The distribution of colors is more uniform than stated by the manufacturer.
Compute the expected counts for each color.
(Round to two decimal places as needed.)
Color
Brown
Yellow
Red
Blue
Orange
Green
Frequency
61
65
56
62
95
66
Expected Count
Observed Distribution of Colors
Color
Frequency
Claimed Proportion
Brown Yellow
61 65
0.14
0.13
Print
Red
56
0.13
Done
Blue
62
0.24
Orange Green
95
0.20
66
0.16
X
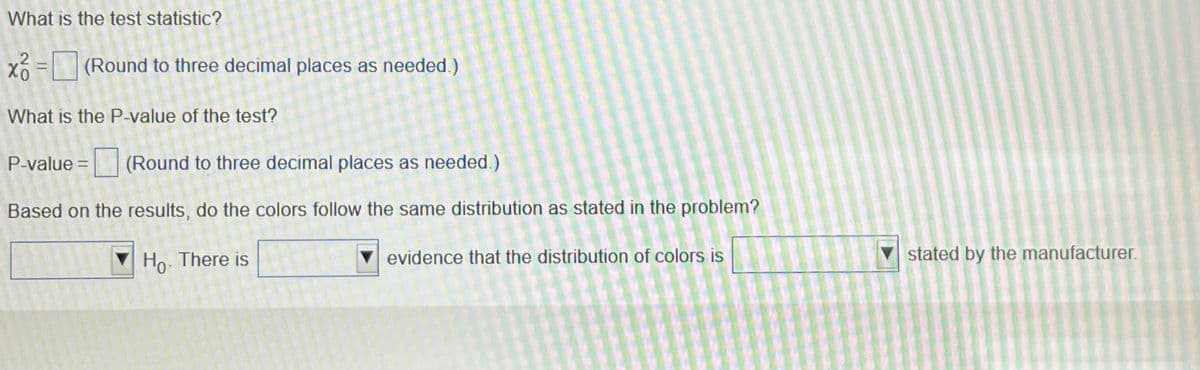
Transcribed Image Text:What is the test statistic?
x² = (Round to three decimal places as needed.)
What is the P-value of the test?
P-value =
(Round to three decimal places as needed.)
Based on the results, do the colors follow the same distribution as stated in the problem?
Ho. There is
evidence that the distribution of colors is
stated by the manufacturer.
Expert Solution
This question has been solved!
Explore an expertly crafted, step-by-step solution for a thorough understanding of key concepts.

This is a popular solution!

Trending now
This is a popular solution!

Step by step
Solved in 3 steps with 1 images

Recommended textbooks for you
Glencoe Algebra 1, Student Edition, 9780079039897…
Algebra
ISBN:
9780079039897
Author:
Carter
Publisher:
McGraw Hill

Holt Mcdougal Larson Pre-algebra: Student Edition…
Algebra
ISBN:
9780547587776
Author:
HOLT MCDOUGAL
Publisher:
HOLT MCDOUGAL
Glencoe Algebra 1, Student Edition, 9780079039897…
Algebra
ISBN:
9780079039897
Author:
Carter
Publisher:
McGraw Hill
Holt Mcdougal Larson Pre-algebra: Student Edition…
Algebra
ISBN:
9780547587776
Author:
HOLT MCDOUGAL
Publisher:
HOLT MCDOUGAL