c) Use indifference curves and the feasible set to show why, given the properties of the optimal choice in part b), it is not optimal to work, say, 10, or 6 hours per day. (continued on next slide)
c) Use indifference curves and the feasible set to show why, given the properties of the optimal choice in part b), it is not optimal to work, say, 10, or 6 hours per day. (continued on next slide)

Chapter17: Capital And Time
Section: Chapter Questions
Problem 17.8P

Related questions
Question
Please help me solving the following sub question please inform me of what the elements of the diagram you draw mean please.
I added a diagram just to possibly help you solve the question but I am not sure if it is correct please label the diagram you complete so I can understand fully.
Thank you
Only 6 c please
Transcribed Image Text:IC,
300
Substitution
effect
225
150
75
Income
effect
Overall
effect
10
12
14
16
18
20
22
24
Hours of free time
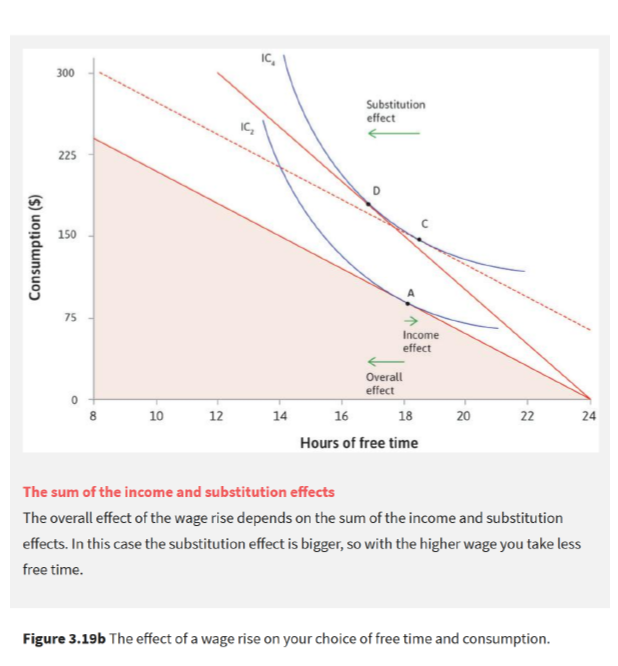
The sum of the income and substitution effects
The overall effect of the wage rise depends on the sum of the income and substitution
effects. In this case the substitution effect is bigger, so with the higher wage you take less
free time.
Figure 3.19b The effect of a wage rise on your choice of free time and consumption.
Consumption ($)
C.
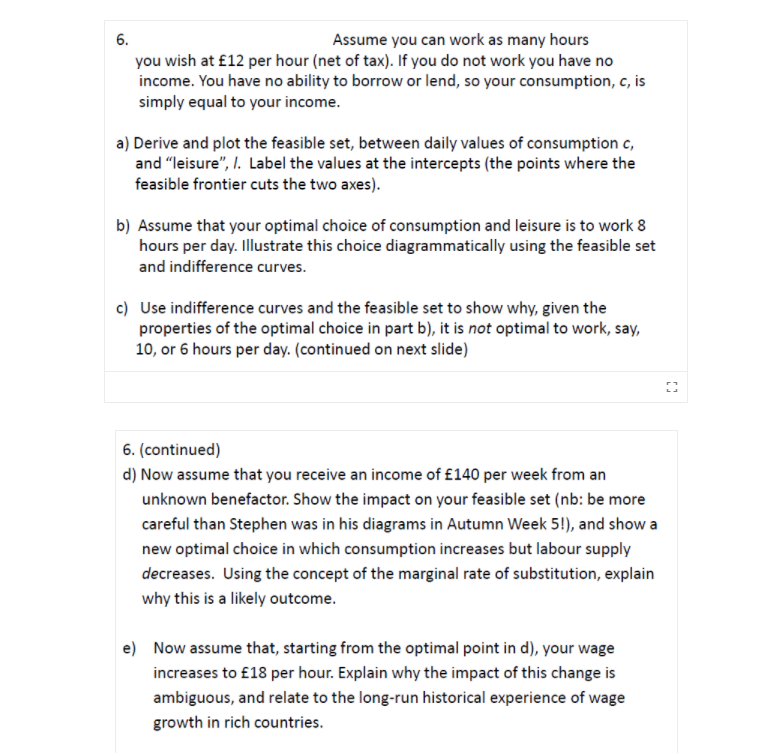
Transcribed Image Text:6.
Assume you can work as many hours
you wish at £12 per hour (net of tax). If you do not work you have no
income. You have no ability to borrow or lend, so your consumption, c, is
simply equal to your income.
a) Derive and plot the feasible set, between daily values of consumption c,
and "leisure", I. Label the values at the intercepts (the points where the
feasible frontier cuts the two axes).
b) Assume that your optimal choice of consumption and leisure is to work 8
hours per day. Illustrate this choice diagrammatically using the feasible set
and indifference curves.
c) Use indifference curves and the feasible set to show why, given the
properties of the optimal choice in part b), it is not optimal to work, say,
10, or 6 hours per day. (continued on next slide)
6. (continued)
d) Now assume that you receive an income of £140 per week from an
unknown benefactor. Show the impact on your feasible set (nb: be more
careful than Stephen was in his diagrams in Autumn Week 5!), and show a
new optimal choice in which consumption increases but labour supply
decreases. Using the concept of the marginal rate of substitution, explain
why this is a likely outcome.
e) Now assume that, starting from the optimal point in d), your wage
increases to £18 per hour. Explain why the impact of this change is
ambiguous, and relate to the long-run historical experience of wage
growth in rich countries.
Expert Solution
This question has been solved!
Explore an expertly crafted, step-by-step solution for a thorough understanding of key concepts.

Step by step
Solved in 3 steps with 4 images

Knowledge Booster


Learn more about
Need a deep-dive on the concept behind this application? Look no further. Learn more about this topic, economics and related others by exploring similar questions and additional content below.Recommended textbooks for you

Exploring Economics
Economics
ISBN:
9781544336329
Author:
Robert L. Sexton
Publisher:
SAGE Publications, Inc

Principles of Economics 2e
Economics
ISBN:
9781947172364
Author:
Steven A. Greenlaw; David Shapiro
Publisher:
OpenStax
Exploring Economics
Economics
ISBN:
9781544336329
Author:
Robert L. Sexton
Publisher:
SAGE Publications, Inc
Principles of Economics 2e
Economics
ISBN:
9781947172364
Author:
Steven A. Greenlaw; David Shapiro
Publisher:
OpenStax