2. In your position as research assistant to a portfolio manager, you need to analyze the profitability of the companies in the portfolio. Using the data for Oracle Corporation (NASDAQ: ORCL) below: Fiscal Year Total Revenue Net Income 2019 39,506 11,083 2018 39,831 3,825 2017 37,728 9,335 2016 37,047 8,901 2015 38,226 9,938 a. Calculate the net profit margin for each year. b. Calculate the compound average annual growth rates (CAGR) for revenue and net income using the GEOMEAN function. Is net income growing more slowly or faster than total revenue? Is this a positive for your investment in the company? c. Calculate the average annual growth rate of total revenue using the AVERAGE function. Is this result more or less accurate than your result in the previous question? Why? d. Create a Column chart of total revenue and net income. Be sure to change the chart so that the x-axis labels contain the year numbers, and format the axis so that 2019 is on the far right side of the axis.
2. In your position as research assistant to a portfolio manager, you need to analyze the profitability of the companies in the portfolio. Using the data for Oracle Corporation (NASDAQ: ORCL) below: Fiscal Year Total Revenue Net Income 2019 39,506 11,083 2018 39,831 3,825 2017 37,728 9,335 2016 37,047 8,901 2015 38,226 9,938 a. Calculate the net profit margin for each year. b. Calculate the compound average annual growth rates (CAGR) for revenue and net income using the GEOMEAN function. Is net income growing more slowly or faster than total revenue? Is this a positive for your investment in the company? c. Calculate the average annual growth rate of total revenue using the AVERAGE function. Is this result more or less accurate than your result in the previous question? Why? d. Create a Column chart of total revenue and net income. Be sure to change the chart so that the x-axis labels contain the year numbers, and format the axis so that 2019 is on the far right side of the axis.
Oh no! Our experts couldn't answer your question.
Don't worry! We won't leave you hanging. Plus, we're giving you back one question for the inconvenience.
Submit your question and receive a step-by-step explanation from our experts in as fast as 30 minutes.
You have no more questions left.
Message from our expert:
We can't answer subjective or opinion-based questions as they require personal interpretation. For guidance on crafting effective writing assignments, we recommend using bartleby research. A question credit has been added to your account for future use.
Your Question:
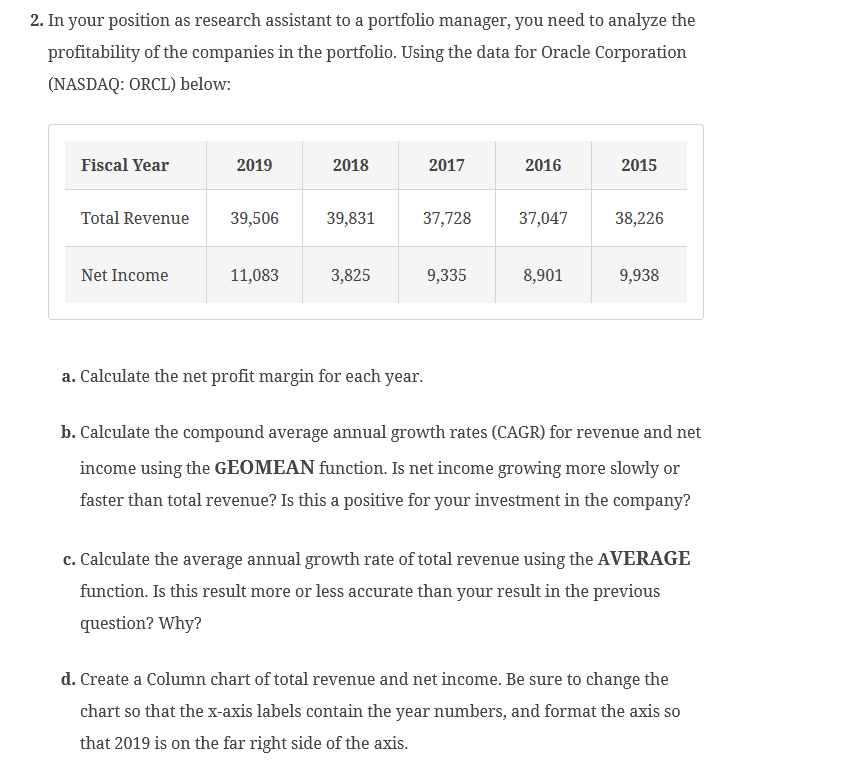
Transcribed Image Text:2. In your position as research assistant to a portfolio manager, you need to analyze the
profitability of the companies in the portfolio. Using the data for Oracle Corporation
(NASDAQ: ORCL) below:
Fiscal Year
Total Revenue
Net Income
2019
39,506
11,083
2018
39,831
3,825
2017
37,728
9,335
2016
37,047
8,901
2015
38,226
9,938
a. Calculate the net profit margin for each year.
b. Calculate the compound average annual growth rates (CAGR) for revenue and net
income using the GEOMEAN function. Is net income growing more slowly or
faster than total revenue? Is this a positive for your investment in the company?
c. Calculate the average annual growth rate of total revenue using the AVERAGE
function. Is this result more or less accurate than your result in the previous
question? Why?
d. Create a Column chart of total revenue and net income. Be sure to change the
chart so that the x-axis labels contain the year numbers, and format the axis so
that 2019 is on the far right side of the axis.

Recommended textbooks for you

Glencoe Algebra 1, Student Edition, 9780079039897…
Algebra
ISBN:
9780079039897
Author:
Carter
Publisher:
McGraw Hill

Glencoe Algebra 1, Student Edition, 9780079039897…
Algebra
ISBN:
9780079039897
Author:
Carter
Publisher:
McGraw Hill