For the given data, the x = Based on the sampling done, the control limits for 3-sigma x chart are: Upper Control Limit (UCL) = Lower Control Limit (LCL;) - inches (round your response to four decimal places). inches (round your response to four decimal places). inches (round your response to four decimal places). Based on the x-chart, is one or more samples beyond the control limits? For the given data, the R=inches (round your response to four decimal places). The control limits for the 3-sigma R-chart are: Upper Control Limit (UCLR)= inches (round your response to four decimal places). Lower Control Limit (LCLR)= inches (round your response to four decimal places). Based on the R-chart, is one or more samples beyond the control limits?
For the given data, the x = Based on the sampling done, the control limits for 3-sigma x chart are: Upper Control Limit (UCL) = Lower Control Limit (LCL;) - inches (round your response to four decimal places). inches (round your response to four decimal places). inches (round your response to four decimal places). Based on the x-chart, is one or more samples beyond the control limits? For the given data, the R=inches (round your response to four decimal places). The control limits for the 3-sigma R-chart are: Upper Control Limit (UCLR)= inches (round your response to four decimal places). Lower Control Limit (LCLR)= inches (round your response to four decimal places). Based on the R-chart, is one or more samples beyond the control limits?

Practical Management Science
6th Edition
ISBN:9781337406659
Author:WINSTON, Wayne L.
Publisher:WINSTON, Wayne L.
Chapter14: Data Mining
Section14.2: Classification Methods
Problem 9P

Related questions
Question
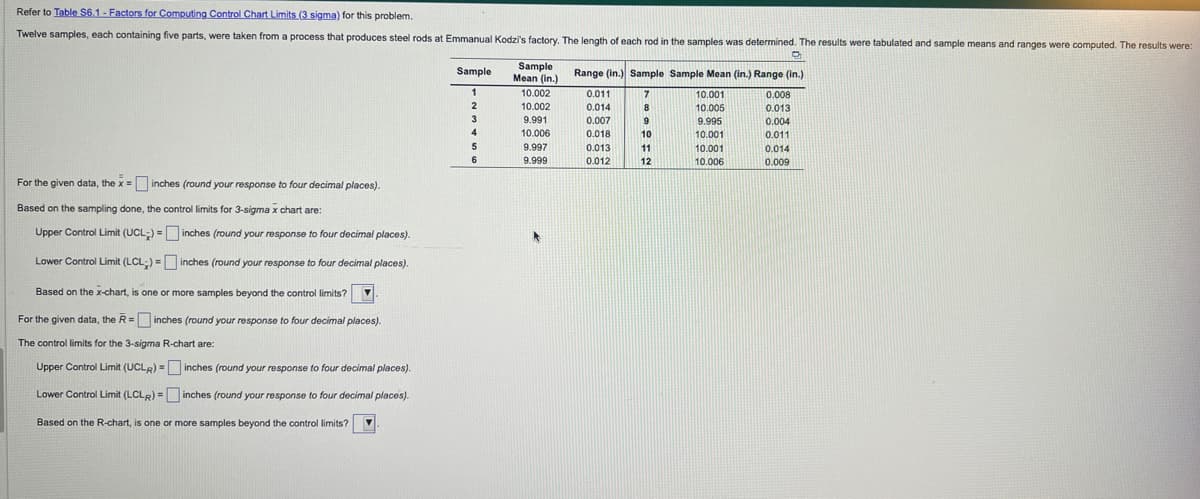
Transcribed Image Text:Refer to Table S6.1-Factors for Computing Control Chart Limits (3 sigma) for this problem.
Twelve samples, each containing five parts, were taken from a process that produces steel rods at Emmanual Kodzi's factory. The length of each rod in the samples was determined. The results were tabulated and sample means and ranges were computed. The results were:
C
Range (in.) Sample Sample Mean (in.) Range (in.)
7
8
9
10
11
12
For the given data, the x = inches (round your response to four decimal places).
Based on the sampling done, the control limits for 3-sigma x chart are:
Upper Control Limit (UCL) =
Lower Control Limit (LCL;) =
inches (round your response to four decimal places).
inches (round your response to four decimal places).
Based on the x-chart, is one or more samples beyond the control limits? ▼
For the given data, the R=
inches (round your response to four decimal places).
The control limits for the 3-sigma R-chart are:
Upper Control Limit (UCLR)=
inches (round your response to four decimal places).
Lower Control Limit (LCLR)=
inches (round your response to four decimal places).
Based on the R-chart, is one or more samples beyond the control limits? ▼.
Sample
1
2
3
4
5
6
Sample
Mean (in.)
10.002
10.002
9.991
10.006
9.997
9.999
0.011
0.014
0.007
0.018
0.013
0.012
10.001
10.005
9.995
10.001
10.001
10.006
0.008
0.013
0.004
0.011
0.014
0.009
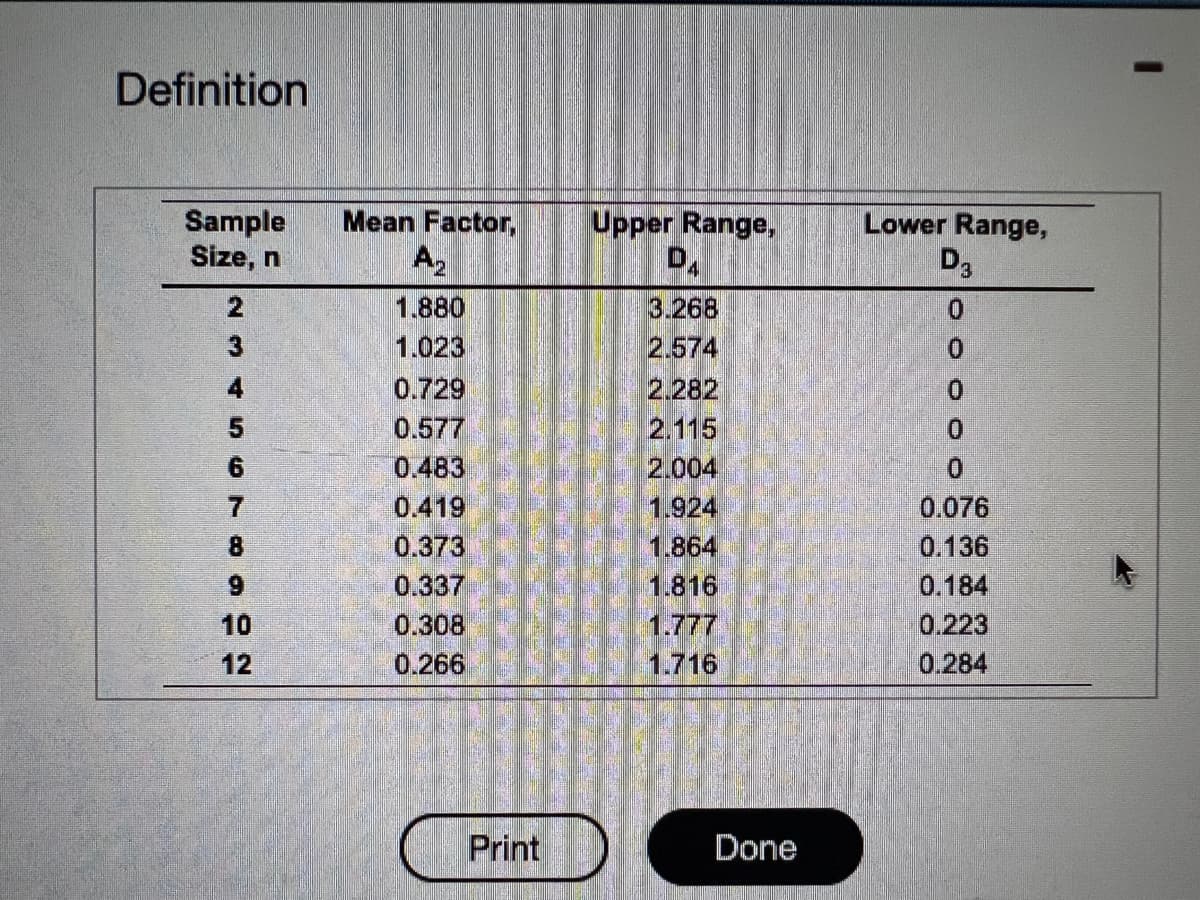
Transcribed Image Text:Definition
Sample
Size, n
2
3
ASETE
6
7
8
9
10
12
Mean Factor,
A₂
1.880
1.023
0.729
0.577
0.483
0.419
0.373
0.337
0.308
0.266
Print
Upper Range,
DA
3.268
2.574
2.282
2.115
2.004
1.924
1.864
1.816
1.777
1.716
Done
Lower Range,
D3
0
0.076
0.136
0.184
0.223
0.284
Expert Solution
This question has been solved!
Explore an expertly crafted, step-by-step solution for a thorough understanding of key concepts.

Step by step
Solved in 3 steps with 8 images

Recommended textbooks for you
Practical Management Science
Operations Management
ISBN:
9781337406659
Author:
WINSTON, Wayne L.
Publisher:
Cengage,
Practical Management Science
Operations Management
ISBN:
9781337406659
Author:
WINSTON, Wayne L.
Publisher:
Cengage,