K The data in the table represent the wealth, in billions of dollars, of six people. Use the data to answer questions (a) through (e). (Assume that sampling is without replacement.) a. Calculate the mean wealth, u, of the six people. P= billion (Round to one decimal place as needed.) b. For samples of size 5, construct a table of all possible samples and their sample means. Wealth 21,18,17,28,29 21,18,17,28,17 x Wealth 21,18,28,29,17 21,17,28,29,17 18,17,28,29,17 x 21,18,17,29,17 (Type an integer or a decimal.) c. Draw a dotplot for the sampling distribution of the sample mean for samples of size 5. 21 18 D 17 28 29 17
K The data in the table represent the wealth, in billions of dollars, of six people. Use the data to answer questions (a) through (e). (Assume that sampling is without replacement.) a. Calculate the mean wealth, u, of the six people. P= billion (Round to one decimal place as needed.) b. For samples of size 5, construct a table of all possible samples and their sample means. Wealth 21,18,17,28,29 21,18,17,28,17 x Wealth 21,18,28,29,17 21,17,28,29,17 18,17,28,29,17 x 21,18,17,29,17 (Type an integer or a decimal.) c. Draw a dotplot for the sampling distribution of the sample mean for samples of size 5. 21 18 D 17 28 29 17

Glencoe Algebra 1, Student Edition, 9780079039897, 0079039898, 2018
18th Edition
ISBN:9780079039897
Author:Carter
Publisher:Carter
Chapter10: Statistics
Section10.1: Measures Of Center
Problem 13PPS

Related questions
Question
Please help. Part A.
Transcribed Image Text:K
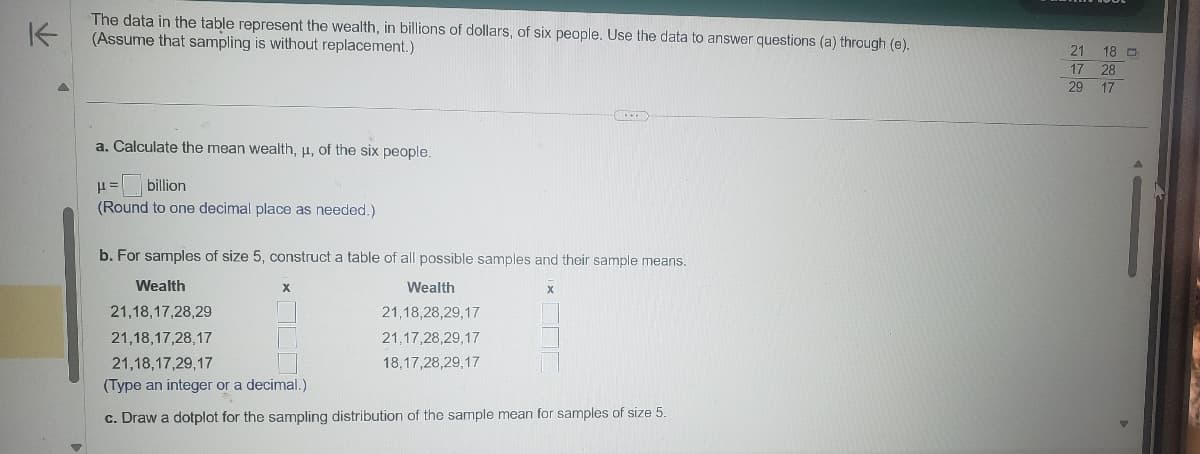
The data in the table represent the wealth, in billions of dollars, of six people. Use the data to answer questions (a) through (e).
(Assume that sampling is without replacement.)
a. Calculate the mean wealth, μ, of the six people.
H=
billion
(Round to one decimal place as needed.)
b. For samples of size 5, construct a table of all possible samples and their sample means.
Wealth
21,18,17,28,29
21,18,17,28,17
Wealth
21,18,28,29,17
21,17,28,29,17
18,17,28,29,17
x
21,18,17,29,17
(Type an integer or a decimal.)
c. Draw a dotplot for the sampling distribution of the sample mean for samples of size 5.
272
21 18
17 28
29 17
Expert Solution
This question has been solved!
Explore an expertly crafted, step-by-step solution for a thorough understanding of key concepts.

This is a popular solution!

Trending now
This is a popular solution!

Step by step
Solved in 3 steps with 15 images

Recommended textbooks for you
Glencoe Algebra 1, Student Edition, 9780079039897…
Algebra
ISBN:
9780079039897
Author:
Carter
Publisher:
McGraw Hill

Holt Mcdougal Larson Pre-algebra: Student Edition…
Algebra
ISBN:
9780547587776
Author:
HOLT MCDOUGAL
Publisher:
HOLT MCDOUGAL

Glencoe Algebra 1, Student Edition, 9780079039897…
Algebra
ISBN:
9780079039897
Author:
Carter
Publisher:
McGraw Hill
Holt Mcdougal Larson Pre-algebra: Student Edition…
Algebra
ISBN:
9780547587776
Author:
HOLT MCDOUGAL
Publisher:
HOLT MCDOUGAL