Look at the amount that is occurring at a frequency of 1 year: At the rainfall rate of the 30-minute event, how much total rain would be expected to fall in an hour? a. (show your work) b. Since this doesn't match the total rainfall for the 1-hour rainfall event, what does it say about the rainfall intensity of the shorter duration events?
Look at the amount that is occurring at a frequency of 1 year: At the rainfall rate of the 30-minute event, how much total rain would be expected to fall in an hour? a. (show your work) b. Since this doesn't match the total rainfall for the 1-hour rainfall event, what does it say about the rainfall intensity of the shorter duration events?

Applications and Investigations in Earth Science (9th Edition)
9th Edition
ISBN:9780134746241
Author:Edward J. Tarbuck, Frederick K. Lutgens, Dennis G. Tasa
Publisher:Edward J. Tarbuck, Frederick K. Lutgens, Dennis G. Tasa
Chapter1: The Study Of Minerals
Section: Chapter Questions
Problem 1LR

Related questions
Question
Use the following information to answer question two to the best of your ability or knowledge
Transcribed Image Text:qualitative
conversion
educational mat
icant interpret
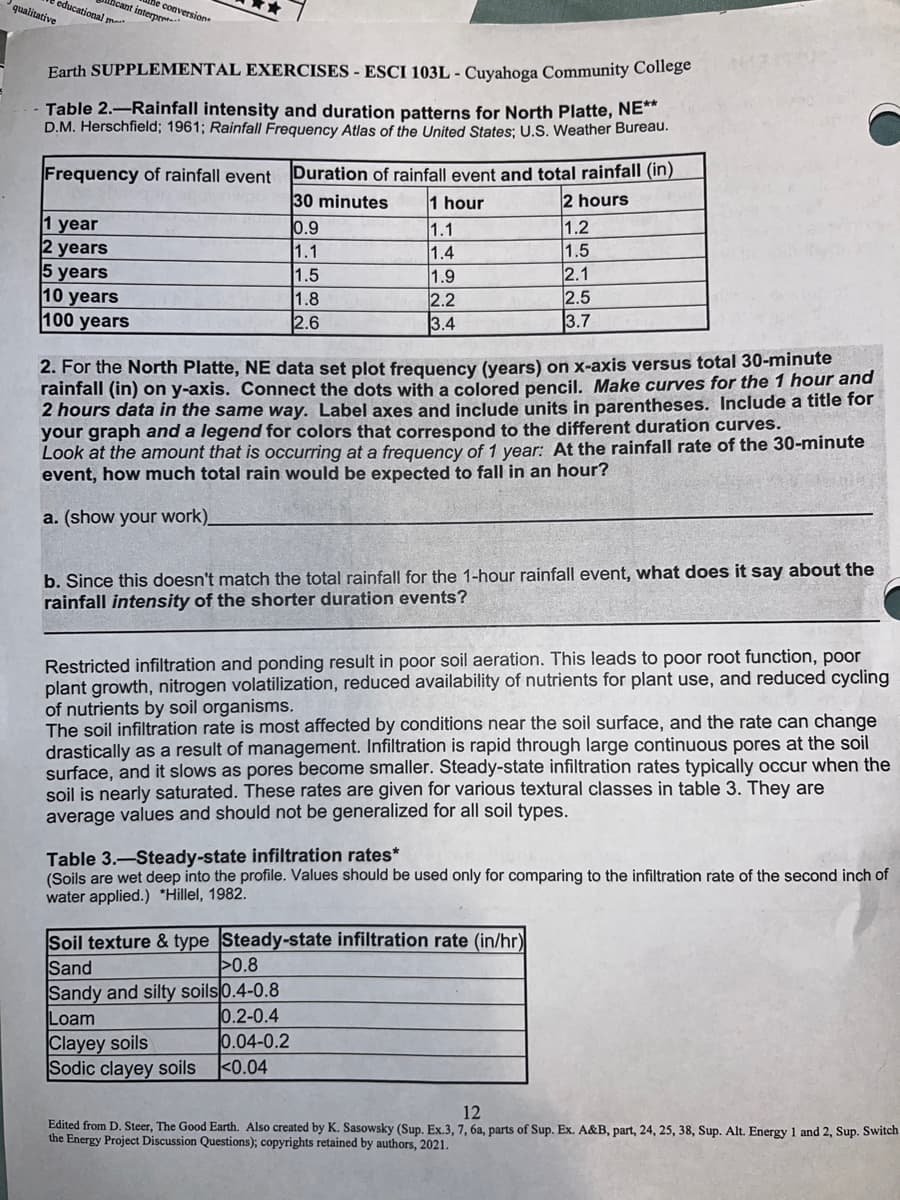
Earth SUPPLEMENTAL EXERCISES - ESCI 103L - Cuyahoga Community College
Table 2.-Rainfall intensity and duration patterns for North Platte, NE**
D.M. Herschfield; 1961; Rainfall Frequency Atlas of the United States; U.S. Weather Bureau.
Frequency of rainfall event
Duration of rainfall event and total rainfall (in)
30 minutes
1 hour
2 hours
1 year
0.9
1.1
1.2
2 years
5 years
10 years
100 years
1.1
1.4
1.5
1.5
1.9
2.1
1.8
2.2
2.5
2.6
3.4
3.7
2. For the North Platte, NE data set plot frequency (years) on x-axis versus total 30-minute
rainfall (in) on y-axis. Connect the dots with a colored pencil. Make curves for the 1 hour and
2 hours data in the same way. Label axes and include units in parentheses. Include a title for
your graph and a legend for colors that correspond to the different duration curves.
Look at the amount that is occurring at a frequency of 1 year: At the rainfall rate of the 30-minute
event, how much total rain would be expected to fall in an hour?
a. (show your work)
b. Since this doesn't match the total rainfall for the 1-hour rainfall event, what does it say about the
rainfall intensity of the shorter duration events?
Restricted infiltration and ponding result in poor soil aeration. This leads to poor root function, poor
plant growth, nitrogen volatilization, reduced availability of nutrients for plant use, and reduced cycling
of nutrients by soil organisms.
The soil infiltration rate is most affected by conditions near the soil surface, and the rate can change
drastically as a result of management. Infiltration is rapid through large continuous pores at the soil
surface, and it slows as pores become smaller. Steady-state infiltration rates typically occur when the
soil is nearly saturated. These rates are given for various textural classes in table 3. They are
average values and should not be generalized for all soil types.
Table 3.-Steady-state infiltration rates*
(Soils are wet deep into the profile. Values should be used only for comparing to the infiltration rate of the second inch of
water applied.) *Hillel, 1982.
Soil texture & type Steady-state infiltration rate (in/hr)
Sand
>0.8
Sandy and silty soils 0.4-0.8
Loam
0.2-0.4
Clayey soils
0.04-0.2
Sodic clayey soils
<0.04
12
Edited from D. Steer, The Good Earth. Also created by K. Sasowsky (Sup. Ex.3, 7, 6a, parts of Sup. Ex. A&B, part, 24, 25, 38, Sup. Alt. Energy 1 and 2, Sup. Switch
the Energy Project Discussion Questions); copyrights retained by authors, 2021.
Expert Solution
This question has been solved!
Explore an expertly crafted, step-by-step solution for a thorough understanding of key concepts.

Step by step
Solved in 3 steps

Recommended textbooks for you
Applications and Investigations in Earth Science …
Earth Science
ISBN:
9780134746241
Author:
Edward J. Tarbuck, Frederick K. Lutgens, Dennis G. Tasa
Publisher:
PEARSON

Exercises for Weather & Climate (9th Edition)
Earth Science
ISBN:
9780134041360
Author:
Greg Carbone
Publisher:
PEARSON

Environmental Science
Earth Science
ISBN:
9781260153125
Author:
William P Cunningham Prof., Mary Ann Cunningham Professor
Publisher:
McGraw-Hill Education
Applications and Investigations in Earth Science …
Earth Science
ISBN:
9780134746241
Author:
Edward J. Tarbuck, Frederick K. Lutgens, Dennis G. Tasa
Publisher:
PEARSON
Exercises for Weather & Climate (9th Edition)
Earth Science
ISBN:
9780134041360
Author:
Greg Carbone
Publisher:
PEARSON
Environmental Science
Earth Science
ISBN:
9781260153125
Author:
William P Cunningham Prof., Mary Ann Cunningham Professor
Publisher:
McGraw-Hill Education

Earth Science (15th Edition)
Earth Science
ISBN:
9780134543536
Author:
Edward J. Tarbuck, Frederick K. Lutgens, Dennis G. Tasa
Publisher:
PEARSON

Environmental Science (MindTap Course List)
Earth Science
ISBN:
9781337569613
Author:
G. Tyler Miller, Scott Spoolman
Publisher:
Cengage Learning

Physical Geology
Earth Science
ISBN:
9781259916823
Author:
Plummer, Charles C., CARLSON, Diane H., Hammersley, Lisa
Publisher:
Mcgraw-hill Education,