Please answer all 4 questions in detailes. Number 3 is already answered it needs graph which I already provided. Thanks 1. What are the worst-, average-, and best-case asymptotic run times for each of the algorithms you implemented? Give intuitive arguments as to why these are the asymptotic run times. 2. Under what circumstances are these asymptotic run times achieved (i.e. for what kind of vectors, sorted, reversed, something else)? 3. Generate three graphs, one for best-, average-, and worst-case scenarios, using the data collected in your experiments and the plotData executable provided on Blackboard. plotData takes three arguments: (a) --data is the file holding the relevant data. (b) --case should be Best, Worst, or Average. (c) --save is the file where the resulting figure will be saved. For example, ./plotData --data best.csv --case Best --save best_fig generates figures for best-case run times in the file best.csv and saves the figure as best_fig.png. 4. For each of the graphs generated in (3), what do you see? Do the curves follow the patterns that we expect? Do certain algorithms seem faster than others in different cases? Are there any surprises?


Please answer all 4 questions in detailes. Number 3 is already answered it needs graph which I already provided. Thanks
1. What are the worst-, average-, and best-case asymptotic run times for each of the
2. Under what circumstances are these asymptotic run times achieved (i.e. for what kind of
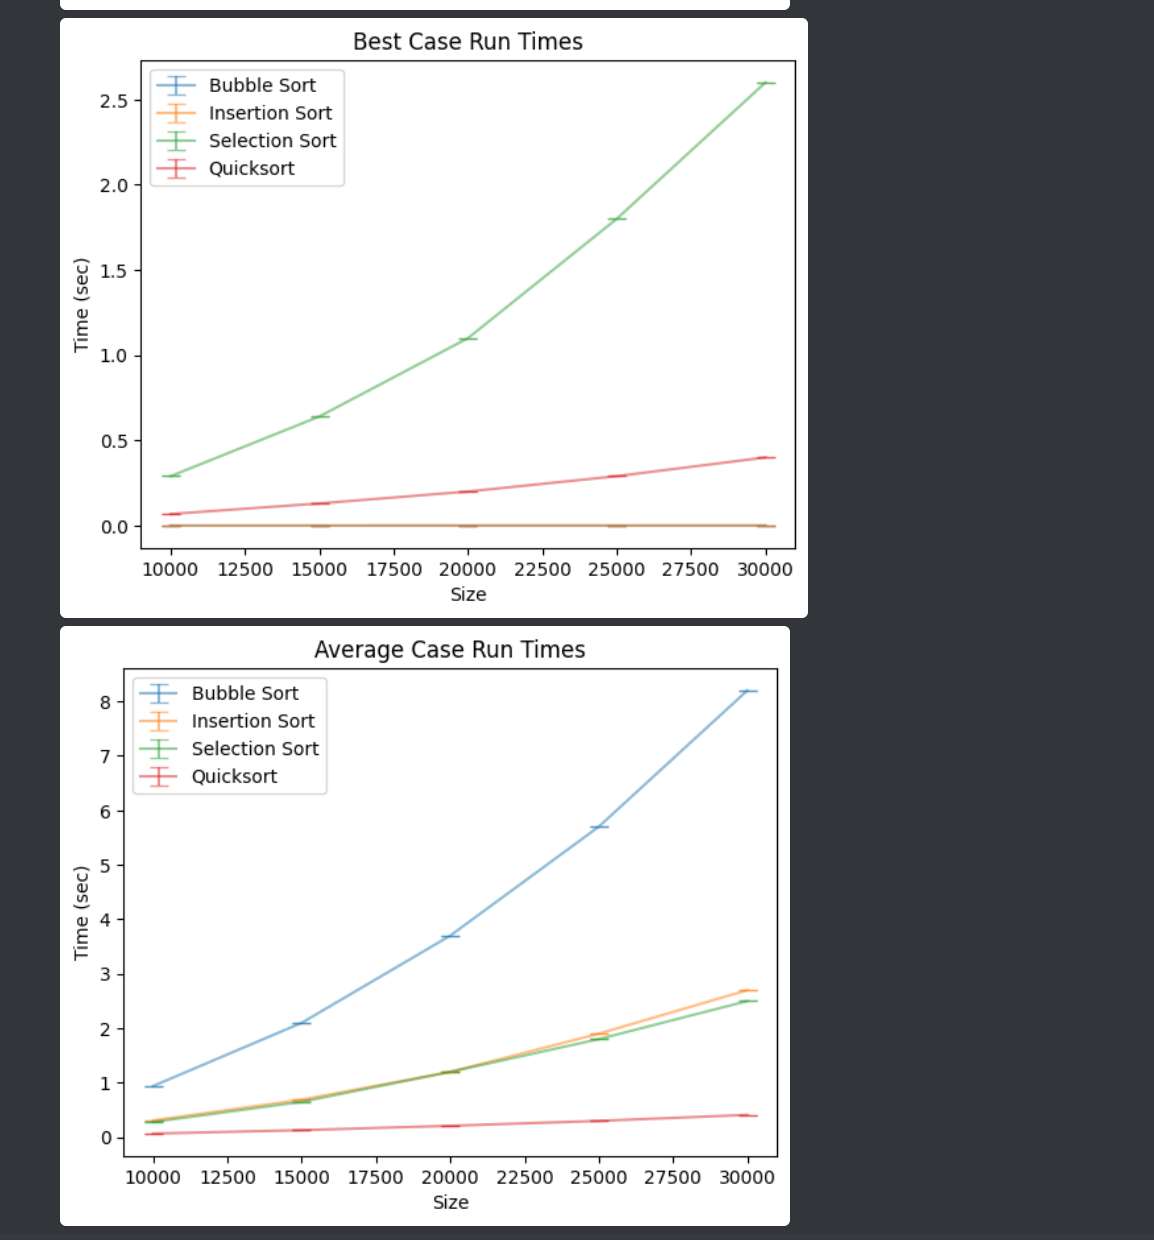
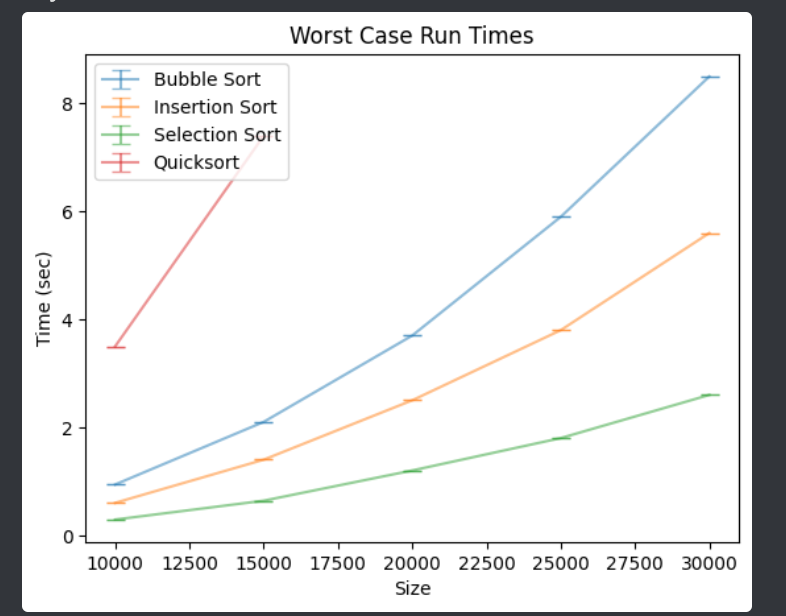
3. Generate three graphs, one for best-, average-, and worst-case scenarios, using the data collected in your experiments and the plotData executable provided on Blackboard. plotData takes three arguments: (a) --data is the file holding the relevant data. (b) --case should be Best, Worst, or Average. (c) --save is the file where the resulting figure will be saved. For example, ./plotData --data best.csv --case Best --save best_fig generates figures for best-case run times in the file best.csv and saves the figure as best_fig.png.
4. For each of the graphs generated in (3), what do you see? Do the curves follow the patterns that we expect? Do certain algorithms seem faster than others in different cases? Are there any surprises?


Trending now
This is a popular solution!

Step by step
Solved in 2 steps


