Solve the following problems using Excel Solver or R Studio. A company produces cars in Atlanta, Boston, Chicago, and Los Angeles. The cars are then shipped to warehouses in Memphis, Milwaukee, New York City, Denver, and San Francisco. The number of cars available at each plant is given in Table 1. Each warehouse needs to have available the number of cars given in Table 2. The distance (in miles) between the cities is given in Table 3. Assuming that the cost (in dollars) of shipping a car equals the distance between two cities, determine an optimal shipping schedule.
Solve the following problems using Excel Solver or R Studio. A company produces cars in Atlanta, Boston, Chicago, and Los Angeles. The cars are then shipped to warehouses in Memphis, Milwaukee, New York City, Denver, and San Francisco. The number of cars available at each plant is given in Table 1. Each warehouse needs to have available the number of cars given in Table 2. The distance (in miles) between the cities is given in Table 3. Assuming that the cost (in dollars) of shipping a car equals the distance between two cities, determine an optimal shipping schedule.

Practical Management Science
6th Edition
ISBN:9781337406659
Author:WINSTON, Wayne L.
Publisher:WINSTON, Wayne L.
Chapter2: Introduction To Spreadsheet Modeling
Section: Chapter Questions
Problem 20P: Julie James is opening a lemonade stand. She believes the fixed cost per week of running the stand...

Related questions
Question
Solve the following problems using Excel Solver or R Studio.
A company produces cars in Atlanta, Boston, Chicago, and Los Angeles. The cars are then shipped to warehouses in Memphis,
Milwaukee, New York City, Denver, and San Francisco. The number of cars available at each plant is given in Table 1. Each
warehouse needs to have available the number of cars given in Table 2. The distance (in miles) between the cities is given in
Table 3. Assuming that the cost (in dollars) of shipping a car equals the distance between two cities, determine an optimal
shipping
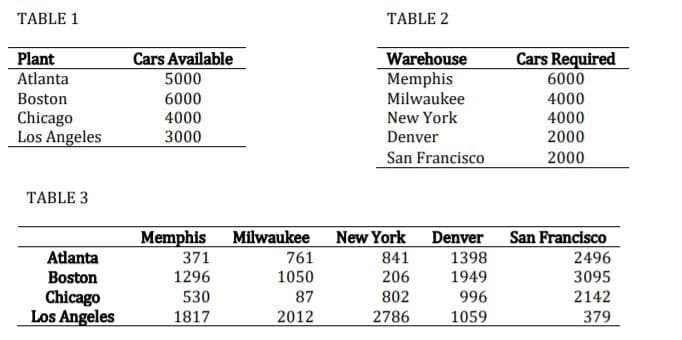
Transcribed Image Text:TABLE 1
TABLE 2
Plant
Atlanta
Cars Available
5000
Cars Required
Warehouse
Memphis
Milwaukee
New York
6000
Boston
4000
6000
4000
Chicago
Los Angeles
4000
3000
Denver
2000
San Francisco
2000
TABLE 3
Memphis Milwaukee
New York Denver
San Francisco
Atlanta
371
1296
761
841
206
1398
1949
2496
3095
Boston
1050
Chicago
Los Angeles
530
87
802
996
2142
1817
2012
2786
1059
379
Expert Solution
This question has been solved!
Explore an expertly crafted, step-by-step solution for a thorough understanding of key concepts.

This is a popular solution!

Trending now
This is a popular solution!

Step by step
Solved in 2 steps with 3 images

Recommended textbooks for you
Practical Management Science
Operations Management
ISBN:
9781337406659
Author:
WINSTON, Wayne L.
Publisher:
Cengage,

Operations Management
Operations Management
ISBN:
9781259667473
Author:
William J Stevenson
Publisher:
McGraw-Hill Education

Operations and Supply Chain Management (Mcgraw-hi…
Operations Management
ISBN:
9781259666100
Author:
F. Robert Jacobs, Richard B Chase
Publisher:
McGraw-Hill Education
Practical Management Science
Operations Management
ISBN:
9781337406659
Author:
WINSTON, Wayne L.
Publisher:
Cengage,
Operations Management
Operations Management
ISBN:
9781259667473
Author:
William J Stevenson
Publisher:
McGraw-Hill Education
Operations and Supply Chain Management (Mcgraw-hi…
Operations Management
ISBN:
9781259666100
Author:
F. Robert Jacobs, Richard B Chase
Publisher:
McGraw-Hill Education


Purchasing and Supply Chain Management
Operations Management
ISBN:
9781285869681
Author:
Robert M. Monczka, Robert B. Handfield, Larry C. Giunipero, James L. Patterson
Publisher:
Cengage Learning

Production and Operations Analysis, Seventh Editi…
Operations Management
ISBN:
9781478623069
Author:
Steven Nahmias, Tava Lennon Olsen
Publisher:
Waveland Press, Inc.