Suppose that Mullen Co, a U.S.-based MNC, knows that it will need 200,000 pounds in one year in order to purchase supplies. It is considering a currency call option to hedge this payable. Currency call options on the pound with expiration dates in one year currently have an exercise price of $1.21 and a premium of $0.02. On the following graph, use the blue points (circle symbols) to plot the contingency graph for hedging this payable with a call option. Plot the points from left to right in the order you would like them to appear. Line segments will connect automatically. Plot the 3 blue points for the following pound spot rates: $1.18, $1.21, $1.27. Note: The vertical axis measures dollar cash outflows from the hedge, which includes the price paid for pounds and any option premium. Dollar Cash Outflows from Hedge (Dollars per Pound) 1.27 1.26 1.25 1.24 1.23 1.22 1.21 1.20 1.19 1.18 1.17 1.16 1.18 1.19 1.20 1.21 1.22 1.23 1.24 1.25 1.26 Pound Spot Rate in One Year (Dollars per Pound) Contingency Graph ?
Suppose that Mullen Co, a U.S.-based MNC, knows that it will need 200,000 pounds in one year in order to purchase supplies. It is considering a currency call option to hedge this payable. Currency call options on the pound with expiration dates in one year currently have an exercise price of $1.21 and a premium of $0.02. On the following graph, use the blue points (circle symbols) to plot the contingency graph for hedging this payable with a call option. Plot the points from left to right in the order you would like them to appear. Line segments will connect automatically. Plot the 3 blue points for the following pound spot rates: $1.18, $1.21, $1.27. Note: The vertical axis measures dollar cash outflows from the hedge, which includes the price paid for pounds and any option premium. Dollar Cash Outflows from Hedge (Dollars per Pound) 1.27 1.26 1.25 1.24 1.23 1.22 1.21 1.20 1.19 1.18 1.17 1.16 1.18 1.19 1.20 1.21 1.22 1.23 1.24 1.25 1.26 Pound Spot Rate in One Year (Dollars per Pound) Contingency Graph ?

Chapter11: Managing Transaction Exposure
Section: Chapter Questions
Problem 50QA

Related questions
Question
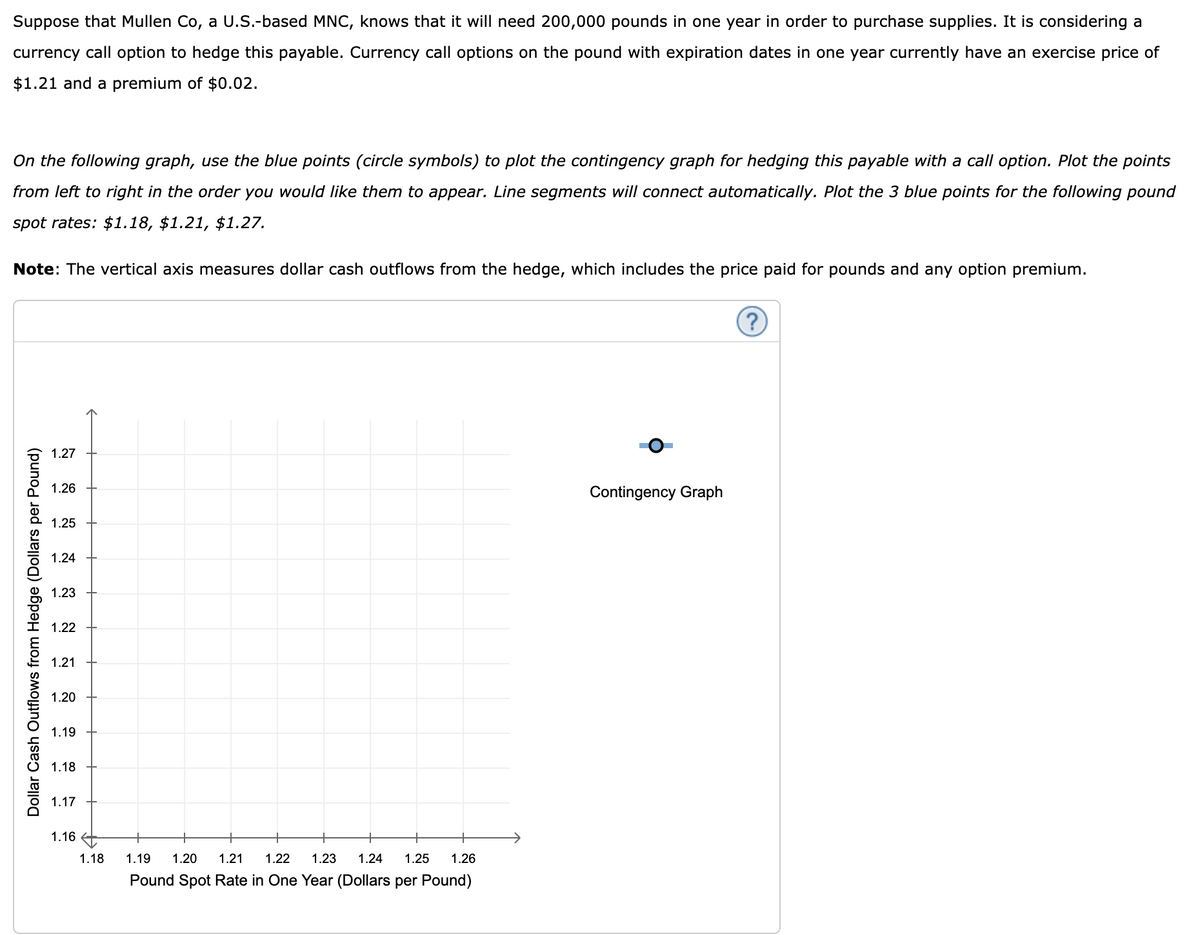
Transcribed Image Text:Suppose that Mullen Co, a U.S.-based MNC, knows that it will need 200,000 pounds in one year in order to purchase supplies. It is considering a
currency call option to hedge this payable. Currency call options on the pound with expiration dates in one year currently have an exercise price of
$1.21 and a premium of $0.02.
On the following graph, use the blue points (circle symbols) to plot the contingency graph for hedging this payable with a call option. Plot the points
from left to right in the order you would like them to appear. Line segments will connect automatically. Plot the 3 blue points for the following pound
spot rates: $1.18, $1.21, $1.27.
Note: The vertical axis measures dollar cash outflows from the hedge, which includes the price paid for pounds and any option premium.
Dollar Cash Outflows from Hedge (Dollars per Pound)
1.27
1.26
1.25
1.24
1.23
1.22
1.21
1.20
1.19
1.18
1.17
1.16
1.18
1.19 1.20 1.21
1.22 1.23 1.24 1.25 1.26
Pound Spot Rate in One Year (Dollars per Pound)
Contingency Graph
?
Expert Solution
This question has been solved!
Explore an expertly crafted, step-by-step solution for a thorough understanding of key concepts.

This is a popular solution!

Trending now
This is a popular solution!

Step by step
Solved in 2 steps

Recommended textbooks for you

EBK CONTEMPORARY FINANCIAL MANAGEMENT
Finance
ISBN:
9781337514835
Author:
MOYER
Publisher:
CENGAGE LEARNING - CONSIGNMENT

Intermediate Financial Management (MindTap Course…
Finance
ISBN:
9781337395083
Author:
Eugene F. Brigham, Phillip R. Daves
Publisher:
Cengage Learning
EBK CONTEMPORARY FINANCIAL MANAGEMENT
Finance
ISBN:
9781337514835
Author:
MOYER
Publisher:
CENGAGE LEARNING - CONSIGNMENT
Intermediate Financial Management (MindTap Course…
Finance
ISBN:
9781337395083
Author:
Eugene F. Brigham, Phillip R. Daves
Publisher:
Cengage Learning