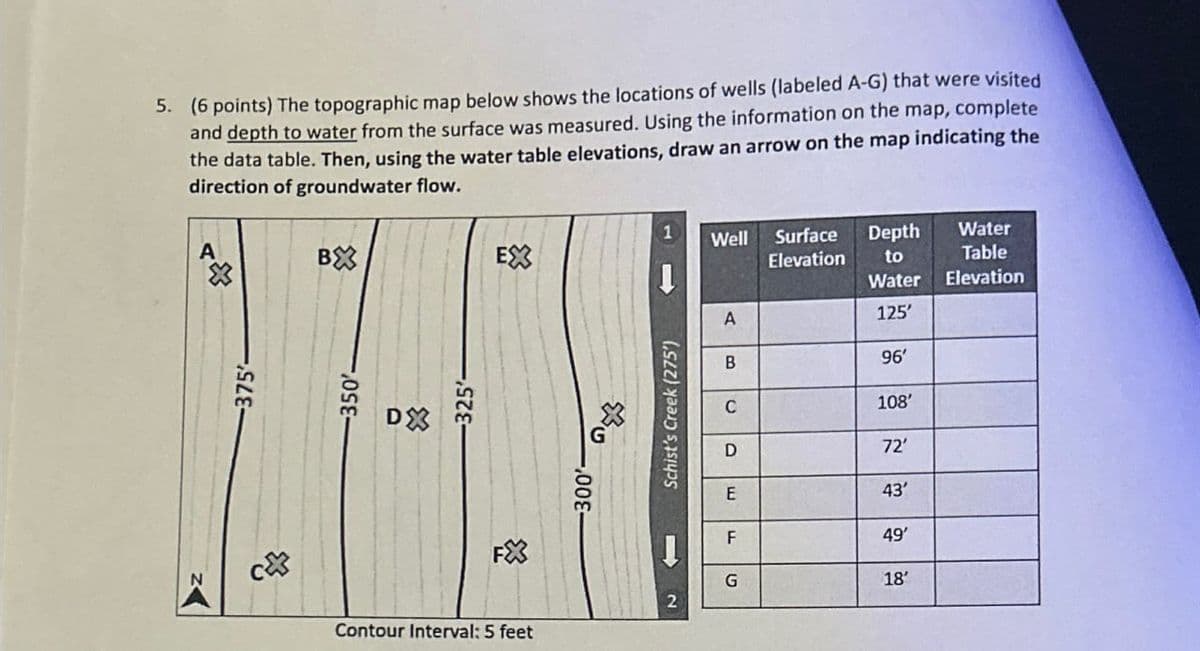
ZA 5. (6 points) The topographic map below shows the locations of wells (labeled A-G) that were visited and depth to water from the surface was measured. Using the information on the map, complete the data table. Then, using the water table elevations, draw an arrow on the map indicating the direction of groundwater flow. -375" BX 350'- DX -325' 1 Well EX Surface Depth Elevation to Water Elevation Water Table 125' A * 300' Schist's Creek (275') B 96' 108' D 72' E 43' F 49' G 18' Contour Interval: 5 feet 72
ZA 5. (6 points) The topographic map below shows the locations of wells (labeled A-G) that were visited and depth to water from the surface was measured. Using the information on the map, complete the data table. Then, using the water table elevations, draw an arrow on the map indicating the direction of groundwater flow. -375" BX 350'- DX -325' 1 Well EX Surface Depth Elevation to Water Elevation Water Table 125' A * 300' Schist's Creek (275') B 96' 108' D 72' E 43' F 49' G 18' Contour Interval: 5 feet 72

Related questions
Question
Transcribed Image Text:ZA
5. (6 points) The topographic map below shows the locations of wells (labeled A-G) that were visited
and depth to water from the surface was measured. Using the information on the map, complete
the data table. Then, using the water table elevations, draw an arrow on the map indicating the
direction of groundwater flow.
-375"
BX
350'-
DX
-325'
1
Well
EX
Surface Depth
Elevation to
Water Elevation
Water
Table
125'
A
*
300'
Schist's Creek (275')
B
96'
108'
D
72'
E
43'
F
49'
G
18'
Contour Interval: 5 feet
72
Expert Solution
This question has been solved!
Explore an expertly crafted, step-by-step solution for a thorough understanding of key concepts.

This is a popular solution!

Trending now
This is a popular solution!

Step by step
Solved in 2 steps with 3 images
