
Videos
Business The change in the size of businesses in a certain Canadian city from one year to the next can he described by a Markov chain. The businesses are classified into three categories based on size: small (2-10 employees), medium (11—43 employees), and large (44 or more employees). The transition matrix for a 1-year period is given below.
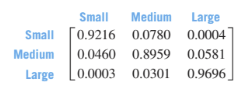
Suppose that in 2015, there were 2094 small, 2363 medium, and 2378 large businesses. Based on this model, find the number of businesses of each type that would be expected in each of the following years. Source: Applied Statistics.
(a) 2016 (b) 2017
(c) Write the transition matrix for a 2-year period.
Based on your answer to part (c), what percent of medium businesses are in each of the following categories after 2 years?
(d) Small businesses (e) Large businesses
Want to see the full answer?
Check out a sample textbook solution
Chapter 10 Solutions
Finite Mathematics (11th Edition)


- Consider a game where you need to fill a 5-digit number by spinning a wheel. Every time you spin the wheel a random digit shows up between 0 – 9 with equal probability. You are to decide where to place the digit in your number. Once you choose a location for the digit you cannot change it. Your objective is to maximize the number you get. (a) Set this up as a Markov Decision Process, identify the states, actions, and transition matrices.arrow_forwardA car rental company has two locations. Each week, 80% of the cars rented at location A are returned to location A and the rest location B. Of the cars rented at location B, 30% are returned to location B by the end of the week and the rest to location A. a. Make a transition diagram for this process. b. Write the transition matrix T for this process. cIf 50% of the company's cars start this week at location A, and 50% at location B, find the proportion of cars that will be at each location one week later Label your answers. d. Write and solve a system of equations to find the stable distribution (correct to 3 decimal places) for this Markov process. Show all calculations and label the row operations.arrow_forwardA study conducted by the Urban Energy Commission in a large metropolitan area indicates the probabilities that homeowners within the area will use certain heating fuels or solar energy during the next 10 years as the major source of heat for their homes. The following transition matrix represents the transition probabilities from one state to another. Elec. Gas Oil Solar Electricity 0.60 0.05 0.10 Natural Gas 0.15 0.85 0.10 0.06 Fuel Oil 0.10 0.02 0.75 0.06 Solar Energy 0.15 0.08 0.05 0.88 Among homeowners within the area, 20% currently use electricity, 35% use natural gas, 40% use oil, and 5% use solar energy as the major source of heat for their homes. In the long run, what percentage of homeowners within the area will be using solar energy as their major source of heating fuel? (Round your answer to one decimal place. Assume the trend continues.) 12.2 X %arrow_forward
- A study conducted by the Urban Energy Commission in a large metropolitan area indicates the probabilities that homeowners within the area will use certain heating fuels or solar energy during the next 10 years as the major source of heat for their homes. The following transition matrix represents the transition probabilities from one state to another. Elec. Gas Oil Solar Electricity 0.60 0.05 0.10 Natural Gas 0.15 0.85 0.10 0.01 Fuel Oil 0.10 0.02 0.75 0.01 Solar Energy 0.15 0.08 0.05 0.98 Among homeowners within the area, 20% currently use electricity, 35% use natural gas, 40% use oil, and 5% use solar energy as the major source of heat for their homes. In the long run, what percentage of homeowners within the area will be using solar energy as their major source of heating fuel? (Round your answer to one decimal place. Assume the trend continues.) %arrow_forwardIn any given day the air quality in a certain city is either good or bad. Records show that when the air quality is good on one day, then there is a 95% chance that it will be good the next day, and when the air quality is bad on one day, then there is 45% chance it will be bad the next day. a. Give the transition matrix. b. if the air quality is good today, what is the probability it will be good two days from now? c. if the air quality is bad today, what is the probability it will be bad three days from now? d. if the there is 20% chance the air quality is good today, what is the probability it will be good tomorrow?arrow_forwardA study conducted by the Urban Energy Commission in a large metropolitan area indicates the probabilities that homeowners within the area will use certain heating fuels or solar energy during the next 10 years as the major source of heat for their homes. The following transition matrix represents the transition probabilities from one state to another. Elec. Gas Oil Solar Electricity 0.60 0.05 0.10 0.15 0.85 0.10 0.05arrow_forward
- A study conducted by the Urban Energy Commission in a large metropolitan area indicates the probabilities that homeowners within the area will use certain heating fuels or solar energy during the next 10 years as the major source of heat for their homes. The transition matrix representing the transition probabilities from one state to another is Elec. Gas Oil Solar Electricity .70 .15 .90 .20 .05 Natural Gas .05 .02 .75 Fuel Oil .10 .08 .05 .95 Solar Energy Among homeowners within the area, 25% currently use electricity, 40% use natural gas, 30% use oil, and 5% use solar energy as the major source of heat for their homes. What is the expected distribution of the homeowners that will be using each type of heating fuel or solar energy within the next decade? (Round your answers to two decimal places.) electricity X % natural gas % fuel oil X % Enter a number. solar energyarrow_forwardThere are two boxes. At first, each box contains one white ball and one black ball. At each step, we draw one ball from each box randomly and exchange them. If we set that State 1 = Box 1 contains no white balls, State 2= Box 1 contains one white ball, State 3 = Box 1 contains two white balls. 1. Find the transition matrix. Answer: 2. After 10 steps, what is the probability that box 1 contains two white balls? Answer: Submit Questionarrow_forwardA study conducted by the Urban Energy Commission in a large metropolitan area indicates the probabilities that homeowners within the area will use certain heating fuels or solar energy during the next 10 years as the major source of heat for their homes. The following transition matrix represents the transition probabilities from one state to another. Electricity 10.2 Natural Gas Fuel Oil Solar Energy Elec. Gas Oil 0.60 0.05 0.10 0.15 0.85 0.10 0.08 Solar 0 0.10 0.02 0.75 0.08 0.15 0.08 0.05 0.84 Among homeowners within the area, 20% currently use electricity, 35% use natural gas, 40% use oil, and 5% use solar energy as the major source of heat for their homes. In the long run, percentage of homeowners within the area will be using solar energy as their major source of heating fuel? (Round your answer to one decimal place. Assume the trend continues.) X % whatarrow_forward
- Aileen, a Scottish spy, has three fake identities that she uses to get information. The process is really quite involved, but she uses a Markov chain process to make it more difficult for her Irish adversaries to track her: "Hope" (state 1), "Trixie"(state 2), and "Fiona" (state 3). The transition matrix is .5 .5 P = .1 .9 .6 .4 On the first observation, Aileen used "Fiona" as her identity. Which of the three fake identities is she most likely to have used on the third observation? O Fiona and Trixie are equally likely Fiona O Hope and Fiona are equally likely None of the others are correct Hope Trixiearrow_forwardA study conducted by the Urban Energy Commission in a large metropolitan area indicates the probabilities that homeowners within the area will use certain heating fuels or solar energy during the next 10 years as the major source of heat for their homes. The following transition matrix represents the transition probabilities from one state to another. Elec. Gas Oil Solar ElectricityNatural GasFuel OilSolar Energy 0.60 0.05 0.10 0 0.15 0.85 0.10 0.07 0.10 0.02 0.75 0.07 0.15 0.08 0.05 0.86 Among homeowners within the area, 20% currently use electricity, 35% use natural gas, 40% use oil, and 5% use solar energy as the major source of heat for their homes. In the long run, what percentage of homeowners within the area will be using solar energy as their major source of heating fuel? (Round your answer to one decimal place. Assume the trend continues.)arrow_forwardYou are analyzing stocks of three companies you are interested in investing in. Suppose that these three stocks are Apple stock (AAPL), Microsoft (MSFT), and Tesla (TSLA). At the end of this month, each month may move up (increase in value), move down (decrease in value) or stay the same. In this case, an experiment consists of observing the price condition across the three stocks. Each of the three conditions (move up, move down, stay same) are equally likely. How many outcomes are in the sample space? List 7 of the outcomes. (use U for move up, D for moving down and S for staying the same) Let A be the event that all the stocks have the same performance. List the outcomes in A. Let B be the event that all of stocks are different. List the outcomes in B. Let C be the event that at least two stocks move up. Are events A and C mutually exclusive? Are events B and C mutually exclusive? What is the probability of ? What is the probability of ? What is the probability of ? What is the…arrow_forward
 Elementary Linear Algebra (MindTap Course List)AlgebraISBN:9781305658004Author:Ron LarsonPublisher:Cengage Learning