
Mathematical Statistics with Applications
7th Edition
ISBN: 9780495110811
Author: Dennis Wackerly, William Mendenhall, Richard L. Scheaffer
Publisher: Cengage Learning
expand_more
expand_more
format_list_bulleted
Videos
Textbook Question
Chapter 10.5, Problem 45E
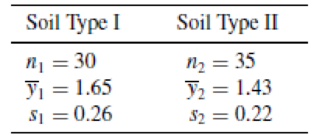
Refer to Exercise 10.21. Construct a 99% confidence interval for the difference in mean shear strengths for the two soil types.
- a Is the value μ1 − μ2 = 0 inside or outside this interval?
- b Based on the interval, should the null hypothesis discussed in Exercise 10.21 be rejected? Why?
- c How does the conclusion that you reached compare with your conclusion in Exercise 10.21?
10.21 Shear strength measurements derived from unconfined compression tests for two types of soils gave the results shown in the following table (measurements in tons per square foot). Do the soils appear to differ with respect to average shear strength, at the 1% significance level?
Expert Solution & Answer

Trending nowThis is a popular solution!

Students have asked these similar questions
Two kinds of thread are being
compared for strength. The data are
as follows:
(kg) s (kg) n
Brand A: 78.3 5.6
14
Brand B: 87.2 6.3
17
Calculate the t'-statistic
alternative hypothesis,
in testing the hypothesis that #₁ = 4.0 kg against the
4.0 kg. Assume normality.
-
The admission office needs your help to evaluate the following hypothesis:
Ho: there is not a significant linear relationship between the two sections
Against:
HA: there is a significant linear relationship between the two sections
1. What is the calculated F statistics? (round to the nearest hundredth)
2. Evaluate the F calculated and indicate if you are going to reject or fail to reject the null hypothesis using an aληα = 0.05 (reject/fail to reject)
The average wind speed in Casper Wyoming has been found to 12.7 miles per hour and in Phoenix Arizona it is 6.2 mph. To test the relationship between the averages, the average wind speed has calculated for a sample of 31 days for each city. The results are reported below. Is there sufficient evidence at alpha = 0.05 to conclude that the average wind speed is greater in Casper or Phoenix ?
Sample size
Casper
31
Phoneix
31
Sample mean
12.85mph
7.9mph
Sample standard deviation
3.3mph
2.8mph
Chapter 10 Solutions
Mathematical Statistics with Applications
Ch. 10.2 - Define and for a statistical test of hypotheses.Ch. 10.2 - An experimenter has prepared a drug dosage level...Ch. 10.2 - Refer to Exercise 10.2. a Find the rejection...Ch. 10.2 - Suppose that we wish to test the null hypothesis...Ch. 10.2 - Let Y1 and Y2 be independent and identically...Ch. 10.2 - We are interested in testing whether or not a coin...Ch. 10.2 - True or False Refer to Exercise 10.6. a The level...Ch. 10.2 - A two-stage clinical trial is planned for testing...Ch. 10.3 - A survey published in the American Journal of...Ch. 10.3 - The hourly wages in a particular industry are...
Ch. 10.3 - The output voltage for an electric circuit is...Ch. 10.3 - The Rockwell hardness index for steel is...Ch. 10.3 - Shear strength measurements derived from...Ch. 10.3 - Prob. 22ECh. 10.3 - Studies of the habits of white-tailed deer...Ch. 10.3 - A study by Childrens Hospital in Boston indicates...Ch. 10.3 - An article in American Demographics reports that...Ch. 10.3 - According to the Washington Post, nearly 45% of...Ch. 10.3 - The state of California is working very hard to...Ch. 10.3 - Prob. 28ECh. 10.3 - Prob. 29ECh. 10.3 - Prob. 30ECh. 10.3 - Prob. 31ECh. 10.3 - In March 2001, a Gallup poll asked. How would you...Ch. 10.3 - A political researcher believes that the fraction...Ch. 10.3 - Exercise 8.58 stated that a random sample of 500...Ch. 10.3 - Michael Sosin investigated determinants that...Ch. 10.3 - Prob. 36ECh. 10.4 - Refer to Exercise 10.19. If the voltage falls as...Ch. 10.4 - Refer to Exercise 10.20. The steel is sufficiently...Ch. 10.4 - Refer to Exercise 10.30. Calculate the value of ...Ch. 10.4 - Refer to Exercise 10.33. The political researcher...Ch. 10.4 - Refer to Exercise 10.34. Using the rejection...Ch. 10.4 - In Exercises 10.34 and 10.41, how large should the...Ch. 10.4 - A random sample of 37 second graders who...Ch. 10.4 - Refer to Exercise 10.43. Find the sample sizes...Ch. 10.5 - Refer to Exercise 10.21. Construct a 99%...Ch. 10.5 - Prob. 46ECh. 10.5 - Prob. 47ECh. 10.5 - Prob. 48ECh. 10.5 - Prob. 49ECh. 10.6 - High airline occupancy rates on scheduled flights...Ch. 10.6 - Two sets of elementary schoolchildren were taught...Ch. 10.6 - A biologist has hypothesized that high...Ch. 10.6 - How would you like to live to be 200 years old?...Ch. 10.6 - Do you believe that an exceptionally high...Ch. 10.6 - A check-cashing service found that approximately...Ch. 10.6 - Prob. 56ECh. 10.6 - Prob. 57ECh. 10.6 - Prob. 58ECh. 10.8 - Why is the Z test usually inappropriate as a test...Ch. 10.8 - Prob. 62ECh. 10.8 - A chemical process has produced, on the average,...Ch. 10.8 - A coin-operated soft-drink machine was designed to...Ch. 10.8 - Operators of gasoline-fueled vehicles complain...Ch. 10.8 - Researchers have shown that cigarette smoking has...Ch. 10.8 - Nutritional information provided by Kentucky Fried...Ch. 10.8 - Prob. 68ECh. 10.8 - Two methods for teaching reading were applied to...Ch. 10.8 - A study was conducted by the Florida Game and Fish...Ch. 10.8 - Under normal conditions, is the average body...Ch. 10.8 - Prob. 72ECh. 10.8 - In Exercise 8.83, we presented some data collected...Ch. 10.8 - Prob. 74ECh. 10.8 - Prob. 75ECh. 10.8 - Prob. 76ECh. 10.8 - Prob. 77ECh. 10.9 - A manufacturer of hard safety hats for...Ch. 10.9 - Prob. 79ECh. 10.9 - Prob. 80ECh. 10.9 - Prob. 81ECh. 10.9 - Exercises 8.83 and 10.73 presented some data...Ch. 10.9 - Prob. 83ECh. 10.9 - An experiment published in The American Biology...Ch. 10.9 - Prob. 85ECh. 10.9 - Aptitude tests should produce scores with a large...Ch. 10.9 - Prob. 87ECh. 10.10 - Refer to Exercise 10.2. Find the power of the test...Ch. 10.10 - Prob. 89ECh. 10.10 - Refer to Exercise 10.5. a Find the power of test 2...Ch. 10.10 - Let Y1, Y2,, Y20 be a random sample of size n = 20...Ch. 10.10 - Consider the situation described in Exercise...Ch. 10.10 - For a normal distribution with mean and variance...Ch. 10.10 - Suppose that Y1, Y2, ,Yn constitute a random...Ch. 10.10 - Prob. 95ECh. 10.10 - Prob. 96ECh. 10.10 - Prob. 97ECh. 10.10 - Prob. 98ECh. 10.10 - Prob. 99ECh. 10.10 - Prob. 100ECh. 10.10 - Prob. 101ECh. 10.10 - Prob. 102ECh. 10.10 - Prob. 103ECh. 10.10 - Refer to the random sample of Exercise 10.103. a...Ch. 10.11 - Let Y1, Y2,, Yn denote a random sample from a...Ch. 10.11 - A survey of voter sentiment was conducted in four...Ch. 10.11 - Prob. 107ECh. 10.11 - Prob. 108ECh. 10.11 - Let X1, X2,, Xm denote a random sample from the...Ch. 10.11 - Show that a likelihood ratio test depends on the...Ch. 10.11 - Suppose that we are interested in testing the...Ch. 10.11 - Prob. 112ECh. 10.11 - Refer to Exercise 10.112. Show that in testing of...Ch. 10.11 - Prob. 114ECh. 10 - True or False. a If the p-value for a test is...Ch. 10 - Prob. 116SECh. 10 - Prob. 117SECh. 10 - Prob. 118SECh. 10 - Prob. 119SECh. 10 - Prob. 120SECh. 10 - Prob. 121SECh. 10 - Prob. 122SECh. 10 - A pharmaceutical manufacturer purchases a...Ch. 10 - Prob. 124SECh. 10 - Prob. 125SECh. 10 - Prob. 126SECh. 10 - Prob. 127SECh. 10 - Prob. 128SECh. 10 - Prob. 129SECh. 10 - Prob. 130SE
Knowledge Booster


Learn more about
Need a deep-dive on the concept behind this application? Look no further. Learn more about this topic, statistics and related others by exploring similar questions and additional content below.Similar questions
- The table below lists measured amounts of redshift and the distances (billions of light-years) to randomly selected astronomical objects. Find the (a) explained variation, (b) unexplained variation, and (c) indicated prediction interval. There is sufficient evidence to support a claim of a linear correlation, so it is reasonable to use he regression equation when making predictions. For the prediction interval, use a 90% confidence level with a redshift of 0.0126. Redshift 0.0233 0.0543 0.0716 0.0396 0.0436 0.0107 Distance 0.34 0.74 0.99 0.56 0.62 0.12 a. Find the explained variation. Round to six decimal places as needed.)arrow_forwardTest the strength of linear relationship with H0 : b = 0 and H1 : b ̸= 0 using significance level α = 0.05. Forecast the electric resistence when the carbon content is 50% and calculate a prediction interval for the predicted point with 95% confidence.arrow_forwardPhysical properties of six flame-retardant fabric samples were investigated in an article. Use the accompanying data and a 0.05 significance level to determine whether a linear relationship exists between stiffness x (mg-cm) and thickness y (mm). State the appropriate null and alternative hypotheses. O Ho: P = 0 H₂: P 0 O Ho: P #O H₂: p=0 O Ho: P = 0 H₁₂ :P #0 8.07 24.69 12.33 6.85 24.22 35.69 y 0.29 0.65 0.31 0.27 0.80 0.57 Compute the value of the sample correlation coefficient, r. Round your answer to four decimal places. r= Calculate the test statistic and determine the P-value. (Round your test statistic to two decimal places and your P-value to three decimal places.) t = P-value = State the conclusion in the problem context. O Fail to reject Ho. The data does not indicate that the population correlation coefficient differs from 0. Reject Ho. The data does not indicate that the population correlation coefficient differs from 0. Fail to reject Ho. The data indicates that the…arrow_forward
- Dars with a mean ultimate tensile strength of 400 Megapascai answ (MPa) with a variance of 81 MPa were delivered by the manufacturer. The project engineer tested 50 steel bars and found out that the mean ultimate tensile strength is 390 MPa. The decision for the extension of the contract with the manufacturer depernds on you c A. the engineer. Test the hypothesis whether there is no significant difference between the two means using a two - tailed witha=0.01. PERFORMANCE TASK We make decisions every day. In making decision, we usually follow certain processes and then made an appropriate interpretation or choice. This is the essence when we conduct hypothesis testing to validate our claim and make a better decision in life. As a wise Columbanite, choose a problem in your community that you can use the process of hypothesis testing. Make a scenario out of it using all the data needed in hypothesis testing then cite your claim about this problem. Lastly test your claim if it is true.…arrow_forwardPhysical properties of six flame-retardant fabric samples were investigated in an article. Use the accompanying data and a 0.05 significance level to determine whether a linear relationship exists between stiffness x (mg-cm) and thickness y (mm). O Ho: P = 0 H₂: P = 0 O Ho: P = 0 H₂:p>0 State the appropriate null and alternative hypotheses. O Ho: P = 0 Ha: P < 0 O Ho: P = 0 Ha: P = 0 X y r = 7.95 24.63 12.39 7.06 24.17 35.70 0.25 0.64 0.32 0.27 0.80 0.56 Compute the value of the sample correlation coefficient, r. Round your answer to four decimal places. Calculate the test statistic and determine the P-value. (Round your test statistic to two decimal places and your P-value to three decimal places.) t = P-value = State the conclusion in the problem context. O Fail to reject Ho. The data does not indicate that the population correlation coefficient differs from 0. O Reject Ho. The data indicates that the population correlation coefficient differs from 0. O Reject Ho. The data does not…arrow_forwardAn article includes the accompanying data on compression strength (lb) for a sample of 12-oz aluminum cans filled with strawberry drink and another sample filled with cola. Beverage Sample Size Sample Mean Sample SD Strawberry Drink 10 535 24 Cola 10 559 15 Does the data suggest that the extra carbonation of cola results in a higher average compression strength? Base your answer on a P-value. (Use ? = 0.05.) State the relevant hypotheses. (Use ?1 for the strawberry drink and ?2 for the cola.) H0: ?1 − ?2 = 0Ha: ?1 − ?2 ≥ 0H0: ?1 − ?2 = 0Ha: ?1 − ?2 ≠ 0 H0: ?1 − ?2 = 0Ha: ?1 − ?2 < 0H0: ?1 − ?2 = 0Ha: ?1 − ?2 > 0 Calculate the test statistic and determine the P-value. (Round your test statistic to one decimal place and your P-value to three decimal places.) t = P-value = State the conclusion in the problem context. Reject H0. The data suggests that cola has a higher average compression strength than the strawberry drink.Reject H0. The…arrow_forward
- In simple linear regression, at what value of the independent variable, X, will the 95% confidence interval for the average value of Y be narrowest? At what value will the 95% prediction interval for the value of Y for a sin gle new observation be narrowest?arrow_forwardA rope manufacturer wants to test their manufacturing process. Their want their rope to hold at least 500 Ibs. They collect a sample of 85 short pieces of rope and subject each to a pulling force until the rope breaks. The sample mean is X= 495.7" · and sample variance s = 568.4" You are to test the hypothesis Ho:H=500. Calculate the test statistic.arrow_forward3) For a sample of 306 students in a basic business communications course, the sample regression line y = 58.813 + 0.2875x was obtained. Here y = final student score at the end of the course x = score on a diagnostic writing skills test given at the beginning of the course The coefficient of determination was 0.1158 and the estimated standard deviation of the estimator of the slope of population regression line was 0.04566. a) Define and interpret the estimates of the regression equation. b) Interpret the coefficient of determination. c) What will happen to the final student score if his diagnostic writing test score increases by 2? d) How can you inmprove this model?arrow_forward
- You may need to use the appropriate technology to answer this question. Consider the data. xi 2 6 9 13 20 yi 6 16 8 27 21 (a) What is the value of the standard error of the estimate? (Round your answer to three decimal places.) (b) Test for a significant relationship by using the t test. Use α = 0.05. State the null and alternative hypotheses. H0: β1 ≠ 0Ha: β1 = 0H0: β1 = 0Ha: β1 ≠ 0 H0: β0 = 0Ha: β0 ≠ 0H0: β0 ≠ 0Ha: β0 = 0H0: β1 ≥ 0Ha: β1 < 0 Find the value of the test statistic. (Round your answer to three decimal places.) Find the p-value. (Round your answer to four decimal places.) p-value = State your conclusion. Do not reject H0. We conclude that the relationship between x and y is significant.Do not reject H0. We cannot conclude that the relationship between x and y is significant. Reject H0. We conclude that the relationship between x and y is significant.Reject H0. We cannot conclude that the relationship between x and y is significant.…arrow_forwardThe data in NutritionStudy include information on nutrition and health habits of a sample of 315 people. One of the variables is VitaminUse, indicating whether a person takes a multivitamin pill regularly or occasionally or not at all. Use technology to test whether the data provide evidence that the proportion taking a vitamin pill regularly is different from 35 % given. Clearly state the null and alternative hypotheses. : : 42 : Pi : P2 :: 0.35 : 2 :: P1 : p2 :: :: r Ho: vs Hg: ::arrow_forwardTwo kinds of thread are being compared for strength. The data are as follows: x (kg) s (kg) 11 78.3 5.6 14 Brand A: Brand B: 87.2 6.3 17 At the 0.05 level of significance, find the critical value of a two-tailed test that μg-HA = 4.0 kg. Assume normality.arrow_forward
arrow_back_ios
SEE MORE QUESTIONS
arrow_forward_ios
Recommended textbooks for you
 MATLAB: An Introduction with ApplicationsStatisticsISBN:9781119256830Author:Amos GilatPublisher:John Wiley & Sons Inc
 Probability and Statistics for Engineering and th...StatisticsISBN:9781305251809Author:Jay L. DevorePublisher:Cengage Learning
 Statistics for The Behavioral Sciences (MindTap C...StatisticsISBN:9781305504912Author:Frederick J Gravetter, Larry B. WallnauPublisher:Cengage Learning
 Elementary Statistics: Picturing the World (7th E...StatisticsISBN:9780134683416Author:Ron Larson, Betsy FarberPublisher:PEARSON
 The Basic Practice of StatisticsStatisticsISBN:9781319042578Author:David S. Moore, William I. Notz, Michael A. FlignerPublisher:W. H. Freeman
 Introduction to the Practice of StatisticsStatisticsISBN:9781319013387Author:David S. Moore, George P. McCabe, Bruce A. CraigPublisher:W. H. Freeman
MATLAB: An Introduction with Applications
Statistics
ISBN:9781119256830
Author:Amos Gilat
Publisher:John Wiley & Sons Inc
Probability and Statistics for Engineering and th...
Statistics
ISBN:9781305251809
Author:Jay L. Devore
Publisher:Cengage Learning
Statistics for The Behavioral Sciences (MindTap C...
Statistics
ISBN:9781305504912
Author:Frederick J Gravetter, Larry B. Wallnau
Publisher:Cengage Learning
Elementary Statistics: Picturing the World (7th E...
Statistics
ISBN:9780134683416
Author:Ron Larson, Betsy Farber
Publisher:PEARSON
The Basic Practice of Statistics
Statistics
ISBN:9781319042578
Author:David S. Moore, William I. Notz, Michael A. Fligner
Publisher:W. H. Freeman
Introduction to the Practice of Statistics
Statistics
ISBN:9781319013387
Author:David S. Moore, George P. McCabe, Bruce A. Craig
Publisher:W. H. Freeman
Hypothesis Testing using Confidence Interval Approach; Author: BUM2413 Applied Statistics UMP;https://www.youtube.com/watch?v=Hq1l3e9pLyY;License: Standard YouTube License, CC-BY
Hypothesis Testing - Difference of Two Means - Student's -Distribution & Normal Distribution; Author: The Organic Chemistry Tutor;https://www.youtube.com/watch?v=UcZwyzwWU7o;License: Standard Youtube License