
Concept explainers
Videos
Reminder Round all answers to two decimal places unless otherwise indicated.
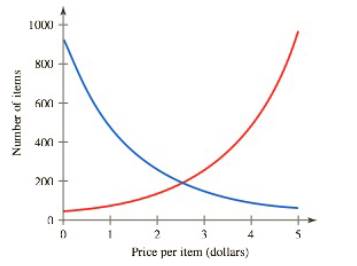
Equilibrium Price This is a continuation of Exorcise 5. The equilibrium price is the price where the supply and demand are the same. In Figure 1.31, the supply curve is in red and the demand curve is in blue. Use this graph to estimate the equilibrium price. How many items are supplied at the equilibrium price?
FIGURE
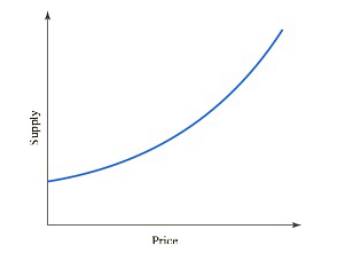
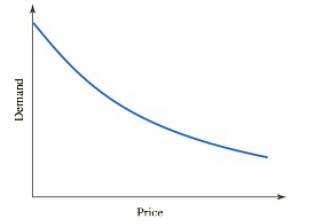
5. Supply and Demand Curves A supply curve is a graph that shows the quantity of a product that is made available by suppliers as a function of the price. Similarly, a demand curve is a graph that shows the quantity of a product that consumers are willing to purchase as a function of the price. Examples of supply and demand curves are shown in Figures
a. Explain in practical terms what the supply curve in Figure
b. Explain in practical terms what the demand curve in Figure 1.30 tells us.
FIGURE
FIGURE
Want to see the full answer?
Check out a sample textbook solution
Chapter 1 Solutions
Functions and Change: A Modeling Approach to College Algebra (MindTap Course List)


 Algebra and Trigonometry (6th Edition)AlgebraISBN:9780134463216Author:Robert F. BlitzerPublisher:PEARSON
 Contemporary Abstract AlgebraAlgebraISBN:9781305657960Author:Joseph GallianPublisher:Cengage Learning
 Linear Algebra: A Modern IntroductionAlgebraISBN:9781285463247Author:David PoolePublisher:Cengage Learning
 Algebra And Trigonometry (11th Edition)AlgebraISBN:9780135163078Author:Michael SullivanPublisher:PEARSON
 Introduction to Linear Algebra, Fifth EditionAlgebraISBN:9780980232776Author:Gilbert StrangPublisher:Wellesley-Cambridge Press
 College Algebra (Collegiate Math)AlgebraISBN:9780077836344Author:Julie Miller, Donna GerkenPublisher:McGraw-Hill Education