
Modern Business Statistics with Microsoft Office Excel (with XLSTAT Education Edition Printed Access Card) (MindTap Course List)
6th Edition
ISBN: 9781337115186
Author: David R. Anderson, Dennis J. Sweeney, Thomas A. Williams, Jeffrey D. Camm, James J. Cochran
Publisher: Cengage Learning
expand_more
expand_more
format_list_bulleted
Concept explainers
Videos
Textbook Question
Chapter 14.6, Problem 37E
In exercise 5, the following data on x = the number of defective parts found and y = the line speed (feet per minute) for a production process at Brawdy Plastics provided the estimated regression equation
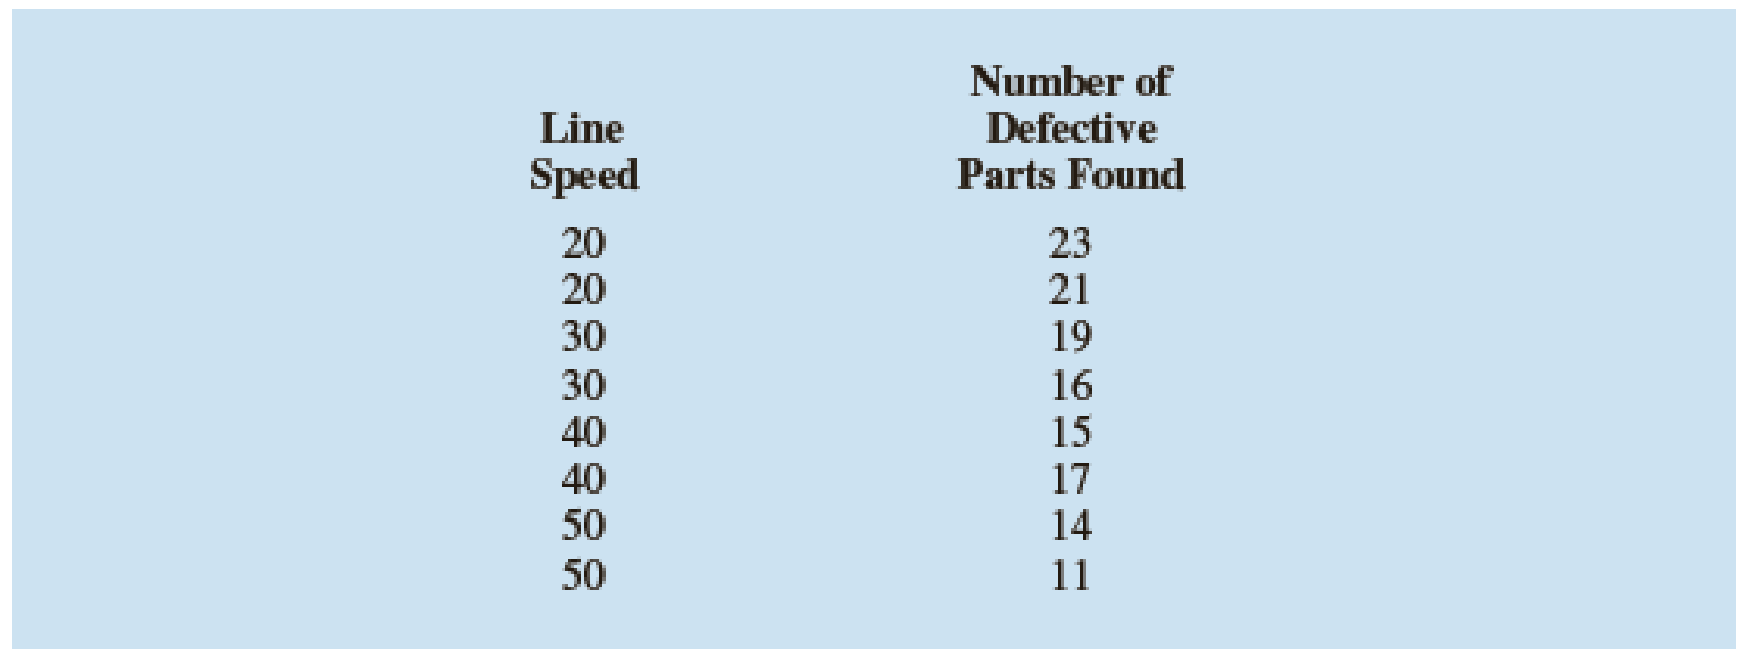
For these data SSE = 16. Develop a 95% confidence interval for the
Expert Solution & Answer
Want to see the full answer?
Check out a sample textbook solution
Students have asked these similar questions
Nine data points of data yield
r=0.867
and the regression equation
y=19.4+0.93x.
Also,
y=64.7.
What is the best predicted value of y for
x=40?
A startup team is interested in creating a productivity app. In estimating the cost of
creating the app, they collected sample data and developed the following regression
equation:
where 1 = number of developers
b₂
a. What is the value of b2 in the equation?
2= number of hours spent creating the app
Is cost of software and testing ($'000)
y = total cost of creating app ($'000)
b. Does it make sense to interpret by in this equation?
OYes
y = -8.825+20.4861 +0.56x2 + 1.02x3
O No
$
c. Predict the cost of creating an app involving 3 developers, 650 hours and $18,000 in
software and testing costs.
Accessibility Investigate
8
A pumpkin farmer wants to create a linear regression model to predict the circumference of a pumpkin (Y-variable) from its weight (X-variable). He samples 40 pumpkins from his pumpkin patch and the mean weight is 14 lbs with a standard deviation of 1 lb. The mean circumference is 50 inches with a standard deviation of 10 inches. The correlation between pumpkin weight and circumference is r = 0.50.
What is the slope of the linear regression model predicting circumference from weight?
7
1
5
3
Chapter 14 Solutions
Modern Business Statistics with Microsoft Office Excel (with XLSTAT Education Edition Printed Access Card) (MindTap Course List)
Ch. 14.2 - Given are five observations for two variables, x...Ch. 14.2 - Given are five observations for two variables, x...Ch. 14.2 - Given are five observations collected in a...Ch. 14.2 - Retail and Trade: Female Managers. The following...Ch. 14.2 - Production Line Speed and Quality Control. Brawdy...Ch. 14.2 - The National Football League (NFL) records a...Ch. 14.2 - Sales Experience and Performance. A sales manager...Ch. 14.2 - Broker Satisfaction. The American Association of...Ch. 14.2 - Companies in the U.S. car rental market vary...Ch. 14.2 - Age and the Price of Wine. For a particular red...
Ch. 14.2 - Laptop Ratings. To help consumers in purchasing a...Ch. 14.2 - Stock Beta. In June of 2016, Yahoo Finance...Ch. 14.2 - Distance and Absenteeism. A large city hospital...Ch. 14.2 - Using a global-positioning-system (GPS)-based...Ch. 14.3 - 15. The data from exercise 1...Ch. 14.3 - The data from exercise 2 follow.
The estimated...Ch. 14.3 - Prob. 17ECh. 14.3 - Price and Quality of Headphones. The following...Ch. 14.3 - Sales Experience and Sales Performance. In...Ch. 14.3 - Price and Weight of Bicycles. Bicycling, the...Ch. 14.3 - Cost Estimation. An important application of...Ch. 14.3 - 22. Refer to exercise 9, where the following data...Ch. 14.5 - The data from exercise 1 follow.
Compute the mean...Ch. 14.5 - The data from exercise 2 follow.
Compute the mean...Ch. 14.5 - The data from exercise 3 follow.
What is the...Ch. 14.5 - Prob. 26ECh. 14.5 - To identify high-paying jobs for people who do not...Ch. 14.5 - Broker Satisfaction Conclusion. In exercise 8,...Ch. 14.5 - Cost Estimation Conclusion. Refer to exercise 21,...Ch. 14.5 - Significance of Fleet Size on Rental Car Revenue....Ch. 14.5 - Significance of Racing Bike Weight on Price. In...Ch. 14.6 - 32. The data from exercise 1...Ch. 14.6 - 33. The data from exercise 2...Ch. 14.6 - Prob. 34ECh. 14.6 - 35. The following data are the monthly salaries y...Ch. 14.6 - 36. In exercise 7, the data on y = annual sales ($...Ch. 14.6 - In exercise 5, the following data on x = the...Ch. 14.6 - Prob. 38ECh. 14.6 - 39. In exercise 12, the following data on x =...Ch. 14.7 - The commercial division of a real estate firm...Ch. 14.7 - Following is a portion of the regression output...Ch. 14.7 - Prob. 43ECh. 14.7 - Auto Racing Helmet. Automobile racing,...Ch. 14.8 - Prob. 45ECh. 14.8 - Prob. 46ECh. 14.8 - Prob. 47ECh. 14.8 - Prob. 48ECh. 14.8 - Prob. 49ECh. 14.9 - Consider the following data for two variables, x...Ch. 14.9 - Prob. 51ECh. 14.9 - Predicting Charity Expenses. Charity Navigator is...Ch. 14.9 - Many countries, especially those in Europe, have...Ch. 14.9 - Valuation of a Major League Baseball Team. The...Ch. 14 - The Dow Jones Industrial Average (DJIA) and the...Ch. 14 - Home Sire and Price. Is the number of square feet...Ch. 14 - Online Education. One of the biggest changes in...Ch. 14 - Machine Maintenance. Jensen Tire & Auto is in the...Ch. 14 - Bus Maintenance. The regional transit authority...Ch. 14 - Studying and Grades. A marketing professor at...Ch. 14 - Used Car Mileage and Price. The Toyota Camry is...Ch. 14 - One measure of the risk or volatility of an...Ch. 14 - As part of a study on transportation safety, the...Ch. 14 - Consumer Reports tested 166 different...Ch. 14 - When trying to decide what car to buy, real value...Ch. 14 - Buckeye Creek Amusement Park is open from the...
Knowledge Booster


Learn more about
Need a deep-dive on the concept behind this application? Look no further. Learn more about this topic, statistics and related others by exploring similar questions and additional content below.Similar questions
- Respiratory Rate Researchers have found that the 95 th percentile the value at which 95% of the data are at or below for respiratory rates in breath per minute during the first 3 years of infancy are given by y=101.82411-0.0125995x+0.00013401x2 for awake infants and y=101.72858-0.0139928x+0.00017646x2 for sleeping infants, where x is the age in months. Source: Pediatrics. a. What is the domain for each function? b. For each respiratory rate, is the rate decreasing or increasing over the first 3 years of life? Hint: Is the graph of the quadratic in the exponent opening upward or downward? Where is the vertex? c. Verify your answer to part b using a graphing calculator. d. For a 1- year-old infant in the 95 th percentile, how much higher is the walking respiratory rate then the sleeping respiratory rate? e. f.arrow_forwardDoes Table 1 represent a linear function? If so, finda linear equation that models the data.arrow_forwardfour pairs of data yield r = 0.942 and the regression equation y-cap = 3x. also, y-bar= 12.75. what is the best predicted value of y for x = 4.6?arrow_forward
- A clothing manufacturer wants to estimate the amount of scrap cloth generated each day by its fabric cutting machines. Eight potential independent variables have been identified. These include the following. = amount of cloth run through cutting machines (in square feet) X2 = machine cutting speed (in feet per minute) age of machine (in years) The manufacturer selects 6 of the candidate independent variables to use in a multiple regression model for estimating y, the amount of scrap cloth (in square feet). Using data collected from 24 different cutting machines operating on different days, the model y = Bo+B1*1 +B,x2+ + Bax, is fit to the data. Fill in the blanks in the analysis of variance (ANOVA) table associated with this model. Do all ... calculations to at least three decimal places.arrow_forwardFind correlation coefficient between the exchange and expenditure from the datagiven below: Obtain the regression equation of exchange on expenditure expenses and find out theexpected exchange of a firm when expenditure is Rs. 25 lakhs. Also find coefficientof determination and interpret your result.arrow_forwardA trucking company considered a multiple regression model for relating the dependent variable y = total daily travel time for one of its drivers (hours) to the predictors x, = distance traveled (miles) and x, = the number of deliveries made. Suppose that the model equation is Y = -0.800 + 0.060x, + 0.900x2 + € (a) What is the mean value of travel time when distance traveled is 50 miles and four deliveries are made? 5.8 v hr (b) How would you interpret ß1 = 0.060, the coefficient of the predictor X1? o When the number of deliveries is held fixed, the average change in travel time associated with a one-mile (i.e. one unit) increase in distance traveled is 0.060 hours. O The total daily travel time increases by 0.060 hours when the distance traveled increases by 1. O When the number of deliveries is constant, the average change in travel time associated with a ten-mile (i.e. one unit) increase in distance traveled is 0.060 hours. O The average change in travel time associated with a…arrow_forward
- For a group of children, mean age is 10 years with S.D. 2·5 years. The average height of the group is 125 cms with S.D. of 13 cms. The coefficient of correlation between age and height is 0-6. Write the equation of two regression lines and explain their use.arrow_forwardListed below are systolic blood pressure measurements (in mm Hg) obtained from the same woman. Find the regression equation, letting the right arm blood pressure be the predictor (x) variable. Find the best predicted systolic blood pressure in the left arm given that the systolic blood pressure in the right arm is 95 mm Hg. Use a significance level of 0.05. Given that the systolic blood pressure in the right arm is 95 mm Hg, the best predicted systolic blood pressure in the left arm is ____ mm Hg. Right Arm Left Arm103 177102 17196 15076 14677 146arrow_forwardA trucking company considered a multiple regression model for relating the dependent variable y = total daily travel time for one of its drivers (hours) to the predictors x₁ = distance traveled (miles) and x₂ = the number of deliveries made. Suppose that the model equation is Y = -0.800+ 0.060x₁ +0.900x₂ + e (a) What is the mean value of travel time when distance traveled is 50 miles and four deliveries are made? hr (b) How would you interpret ₁ = 0.060, the coefficient of the predictor x₁? O When the number of deliveries is constant, the average change in travel time associated with a ten-mile (i.e. one unit) increase in distance traveled is 0.060 hours. O The total daily travel time increases by 0.060 hours when the distance traveled increases by 1. O When the number of deliveries is held fixed, the average change in travel time associated with a one-mile (i.e. one unit) increase in distance traveled is 0.060 hours. O The average change in travel time associated with a one-mile (i.e.…arrow_forward
- The data point height=175 cm, height =80 cm was misrecorded as height=145 cm, height =80 cm. If we use the simple linear regression and do not correct the mistake, what is the impact of this point on the model?arrow_forward4b) The data shows a systolic and a diastolic blood pressure of certain patients. Find the linear regression equation, using the first variable x (systolic) as the independent variable. Find the best predicted diastolic blood pressure for a patient with a systolic blood pressure (y) reading of 140. What is the correlation coefficient, r? Using a significance level of a = 0.05, is there a significant linear relationship between systolic and diastolic blood pressure? Blood Pressure: Systolic Diastolic 112 125 115 136 143 116 123 124 elimii 70 89 65 90 97 64 SUTT nisinoo aqdM 21.SS bns aqdM 78 ahoqnis erit te zbesqz steb ils to 69 bns ago 20.EI to adimil srit terit sonabilnos 2 nistnoo aqdM 21.SS bnc agdM sgsavs arit ferli mislo a hoqnis orti roqque lovedni sonsbilnos 3028 wolsd insmsisiz tomo artezorio SeqdM 2.55 al 2.SS to sulavadi znistmoodi ezusaed mish ads toqque ton zaob 2.55 to sulsy sdt anistroo ti sausosd mislo ert hoqquz 200b to sulav orit nisinoo ton zoob 11 saussed misbb adi…arrow_forwardWater is being poured into a large cone shape cistern. The volume of water measured and centimeters cubed is reported at different time intervals measured in seconds. A regression analysis was completed and is displayed in the computer output. what is the equation of the lease squared regression line?arrow_forward
arrow_back_ios
SEE MORE QUESTIONS
arrow_forward_ios
Recommended textbooks for you
 Glencoe Algebra 1, Student Edition, 9780079039897...AlgebraISBN:9780079039897Author:CarterPublisher:McGraw Hill
 Trigonometry (MindTap Course List)TrigonometryISBN:9781305652224Author:Charles P. McKeague, Mark D. TurnerPublisher:Cengage Learning
 Calculus For The Life SciencesCalculusISBN:9780321964038Author:GREENWELL, Raymond N., RITCHEY, Nathan P., Lial, Margaret L.Publisher:Pearson Addison Wesley,
 Big Ideas Math A Bridge To Success Algebra 1: Stu...AlgebraISBN:9781680331141Author:HOUGHTON MIFFLIN HARCOURTPublisher:Houghton Mifflin Harcourt
Glencoe Algebra 1, Student Edition, 9780079039897...
Algebra
ISBN:9780079039897
Author:Carter
Publisher:McGraw Hill
Trigonometry (MindTap Course List)
Trigonometry
ISBN:9781305652224
Author:Charles P. McKeague, Mark D. Turner
Publisher:Cengage Learning
Calculus For The Life Sciences
Calculus
ISBN:9780321964038
Author:GREENWELL, Raymond N., RITCHEY, Nathan P., Lial, Margaret L.
Publisher:Pearson Addison Wesley,
Big Ideas Math A Bridge To Success Algebra 1: Stu...
Algebra
ISBN:9781680331141
Author:HOUGHTON MIFFLIN HARCOURT
Publisher:Houghton Mifflin Harcourt
Correlation Vs Regression: Difference Between them with definition & Comparison Chart; Author: Key Differences;https://www.youtube.com/watch?v=Ou2QGSJVd0U;License: Standard YouTube License, CC-BY
Correlation and Regression: Concepts with Illustrative examples; Author: LEARN & APPLY : Lean and Six Sigma;https://www.youtube.com/watch?v=xTpHD5WLuoA;License: Standard YouTube License, CC-BY