
Modern Business Statistics with Microsoft Office Excel (with XLSTAT Education Edition Printed Access Card) (MindTap Course List)
6th Edition
ISBN: 9781337115186
Author: David R. Anderson, Dennis J. Sweeney, Thomas A. Williams, Jeffrey D. Camm, James J. Cochran
Publisher: Cengage Learning
expand_more
expand_more
format_list_bulleted
Concept explainers
Videos
Textbook Question
Chapter 2, Problem 57SE
Google has changed its strategy with regard to how much it invests in advertising, and which media it uses to do so. The following table shows Google’s marketing budget in millions of dollars for 2008 and 2011 (The Wall Street Journal, March 27, 2012).
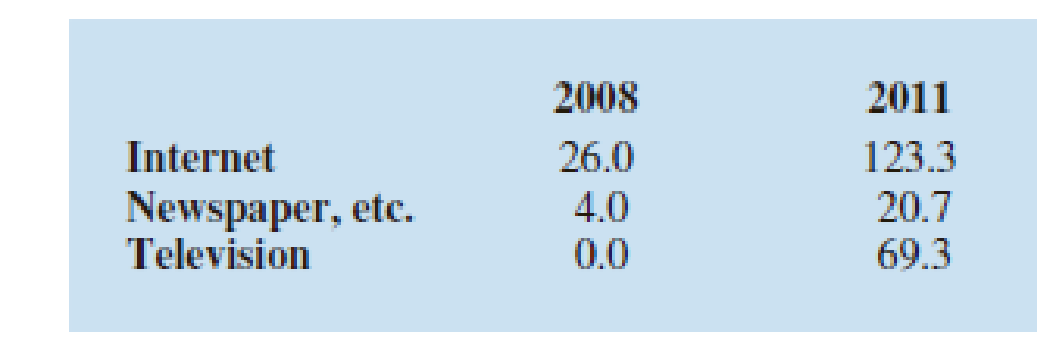
- a. Construct a side-by-side bar chart with year as the variable on the horizontal axis. Comment on any trend in the display.
- b. Convert the above table to percentage allocation for each year. Construct a stacked bar chart with year as the variable on the horizontal axis.
- c. Is the display in part (a) or part (b) more insightful? Explain.
Expert Solution & Answer
Want to see the full answer?
Check out a sample textbook solution
Students have asked these similar questions
Use a graphing calculator to make a scatter plot of the amounts Leah willaccumulate for years 1 through 5.
Google has changed its strategy with regard to how much and over which media it invests in advertising. The following table shows Google's marketing budget in millions of dollars for 2008 and 2011 (The Wall Street Journal, March 27, 2012).
2008
2011
Internet
$26.0
$123.3
Newspaper, etc.
$4.0
$20.7
Television
$0.0
$69.3
Convert the above table to percentage allocation for each year. Round your answers to one decimal place, if necessary. If your answer is zero, enter "0"
2008 2011
Internet ( ) % ( )%
Newspaper ( ) % ( )%
Television ( ) % ( )%
Total ( )% ( )%
What percentage of the shoppers have an email account
Chapter 2 Solutions
Modern Business Statistics with Microsoft Office Excel (with XLSTAT Education Edition Printed Access Card) (MindTap Course List)
Ch. 2.1 - Methods
1. The response to a question has three...Ch. 2.1 - 2. A partial relative frequency distribution is...Ch. 2.1 - A questionnaire provides 58 Yes, 42 No, and 20...Ch. 2.1 -
For the 2010–2011 viewing season, the top five...Ch. 2.1 -
In alphabetical order, the six most common last...Ch. 2.1 - Top Rated Television Show Networks. Nielsen Media...Ch. 2.1 - Airline Customer Satisfaction Survey. Many...Ch. 2.1 - Prob. 8ECh. 2.1 - Prob. 9ECh. 2.1 -
VirtualTourist provides ratings for hotels...
Ch. 2.2 - 11. Consider the following data.
Develop a...Ch. 2.2 - 12. Consider the following frequency...Ch. 2.2 - Construct a histogram for the data in exercise...Ch. 2.2 - Prob. 14ECh. 2.2 - Construct a stem-and-leaf display for the...Ch. 2.2 - Construct a stem-and-leaf display for the...Ch. 2.2 - Applications
17. A doctor’s office staff studied...Ch. 2.2 - NBA Total Player Ratings. CBSSports.com developed...Ch. 2.2 - Prob. 19ECh. 2.2 - CEO Time in Meetings. The London School of...Ch. 2.2 - Quantcast.com provides the number of people from...Ch. 2.2 - Top U.S. Franchises. Entrepreneur magazine ranks...Ch. 2.2 - Prob. 24ECh. 2.2 - Best Paying College Degrees. Each year America.EDU...Ch. 2.2 - Prob. 26ECh. 2.3 - The following data are for 30 observations...Ch. 2.3 - The following observations are for two...Ch. 2.3 - Daytona 500 Automobile Makes Average Speeds. The...Ch. 2.3 - Daytona 500 Average Speeds of Winners. The...Ch. 2.3 - 31. Recently, management at Oak Tree Golf Course...Ch. 2.3 - Household Income Levels. The following...Ch. 2.3 - 33. Each year Forbes ranks the world’s most...Ch. 2.3 - Prob. 34ECh. 2.3 -
The U.S. Department of Energy's Fuel Economy...Ch. 2.4 - The following 20 observations are for two...Ch. 2.4 - Prob. 37ECh. 2.4 - The following crosstabulation summarizes the data...Ch. 2.4 - Driving Speed and Fuel Efficiency. A study on...Ch. 2.4 - The DATAfile Snow contains average annual snowfall...Ch. 2.4 - Hypertension and Heart Disease. People often wait...Ch. 2.4 -
Smartphones are mobile phones with Internet,...Ch. 2.4 - Store Managers Time Study. The Northwest regional...Ch. 2 - SAT Scores. The SAT is a standardized test used by...Ch. 2 - Median Household Incomes. The file MedianHousehold...Ch. 2 - State Populations. Data showing the population by...Ch. 2 - Startup Company Funds. According to the Wall...Ch. 2 - Complaints Reported to BBB. Consumer complaints...Ch. 2 - Stock Price Volatility. The term “beta” refers to...Ch. 2 - Education Level and Household Income. The U.S....Ch. 2 - Prob. 51SECh. 2 - Best Places to Work. Fortune magazine publishes an...Ch. 2 - Prob. 53SECh. 2 - Prob. 54SECh. 2 - Prob. 55SECh. 2 - Prob. 56SECh. 2 -
Google has changed its strategy with regard to...Ch. 2 -
A zoo has categorized its visitors into three...Ch. 2 - Pelican Stores, a division of National Clothing,...Ch. 2 -
Motion Picture Industry
The motion picture...Ch. 2 - Cincinnati, Ohio, also known as the Queen City,...Ch. 2 - Jon Weideman, first shift foreman for Cut-Rate...
Knowledge Booster


Learn more about
Need a deep-dive on the concept behind this application? Look no further. Learn more about this topic, statistics and related others by exploring similar questions and additional content below.Similar questions
- Find the mean hourly cost when the cell phone described above is used for 240 minutes.arrow_forwardThe owner of Showtime Movie Theaters, Inc., would like to predict weekly gross revenue as a function of advertising expenditures. Historical data for a sample of eight weeks follow. Click on the datafile logo to reference the data .arrow_forwardThe following table provides monthly revenue values for Tedstar, Inc., a company thatsells valves to large industrial firms. The monthly revenue data have been graphed usinga line chart in the following figure. a. What are the problems with the layout and display of this line chart?b. Create a new line chart for the monthly revenue data at Tedstar, Inc. Format the chartto make it easy to read and interpret.arrow_forward
- Describe the form, trend, and variation of the scatter plot.arrow_forwardComplete the following: Draw a scatter plot of the data below. b. Draw a trend line. Write its equation Estimate the number of Youtube subscribers in 2030. 5. a. C. Year 2005 2010 2015 2020 Subscribers in Millions 17.7 39.9 54.9 63.0arrow_forwardSouthwest Airlines had 81.1 million domestic boardings in a recent year, followed by Delta Airlines with 79.4 million, American Airlines with 72.6 million, United Airlines with 56.3 million, Northwest Airlines with 43.3 million, US Airways with 37.8 million, and Continental Airlines with 31.5 million, according to T-100 Domestic Market. Construct a pie chart to depict this information. List down the variable of the above data. Describe whether each variable are qualitative or quantitative data? Explain your answer. Describe the level of measurement for the variables. Explain your answer.arrow_forward
- Please show steps in Excel. The 32 teams in the National Football League (NFL) are worth, on average, $1.17 billion, 5% more than last year. The datafile NFLTEAMVALUE shows the annual revenue ($millions) and the estimated team value ($ millions) for the 32 NFL teams (Forbes website, February 28, 2014). a.Develop a scatter diagram with Revenue on the horizontal axis and Value on the vertical axis. Does there appear that there is any relationship between the two variables? b. What is the sample correlation coefficient? What can you say about the strength of the relationship between Revenue and Value? Team Revenue ($ millions) Current Value ($ millions) Arizona Cardinals 253 961 Atlanta Falcons 252 933 Baltimore Ravens 292 1,227 Buffalo Bills 256 870 Carolina Panthers 271 1,057 Chicago Bears 298 1,252 Cincinnati Bengals 250 924 Cleveland Browns 264 1,005 Dallas Cowboys 539 2,300 Denver Broncos 283 1,161 Detroit Lions 248 900 Green Bay Packers 282 1,183 Houston…arrow_forwardAS2. NO10. DATA ANALYSISarrow_forwardThe dollar values take into account the changes in the economy over the years (i.e., inflation). A typical middle-income household in 1980 earned $35,284. A similar household in 2009 earned $39,971. What was the relative increase in income for these households from 1980 to 2009? Round to the nearest one percent.arrow_forward
arrow_back_ios
arrow_forward_ios
Recommended textbooks for you
 Glencoe Algebra 1, Student Edition, 9780079039897...AlgebraISBN:9780079039897Author:CarterPublisher:McGraw Hill
 Holt Mcdougal Larson Pre-algebra: Student Edition...AlgebraISBN:9780547587776Author:HOLT MCDOUGALPublisher:HOLT MCDOUGAL
 College Algebra (MindTap Course List)AlgebraISBN:9781305652231Author:R. David Gustafson, Jeff HughesPublisher:Cengage Learning
 Algebra: Structure And Method, Book 1AlgebraISBN:9780395977224Author:Richard G. Brown, Mary P. Dolciani, Robert H. Sorgenfrey, William L. ColePublisher:McDougal Littell
Glencoe Algebra 1, Student Edition, 9780079039897...
Algebra
ISBN:9780079039897
Author:Carter
Publisher:McGraw Hill
Holt Mcdougal Larson Pre-algebra: Student Edition...
Algebra
ISBN:9780547587776
Author:HOLT MCDOUGAL
Publisher:HOLT MCDOUGAL
College Algebra (MindTap Course List)
Algebra
ISBN:9781305652231
Author:R. David Gustafson, Jeff Hughes
Publisher:Cengage Learning
Algebra: Structure And Method, Book 1
Algebra
ISBN:9780395977224
Author:Richard G. Brown, Mary P. Dolciani, Robert H. Sorgenfrey, William L. Cole
Publisher:McDougal Littell
Correlation Vs Regression: Difference Between them with definition & Comparison Chart; Author: Key Differences;https://www.youtube.com/watch?v=Ou2QGSJVd0U;License: Standard YouTube License, CC-BY
Correlation and Regression: Concepts with Illustrative examples; Author: LEARN & APPLY : Lean and Six Sigma;https://www.youtube.com/watch?v=xTpHD5WLuoA;License: Standard YouTube License, CC-BY