
a.
To find: The error in the given statement.
The statement given by student - the graph of
Given data: The statement proposed by student is:
The graph of
Method/Formula used:
Consider a function
Explanation:
Consider a function
(graph C), are shown in Fig. 1. 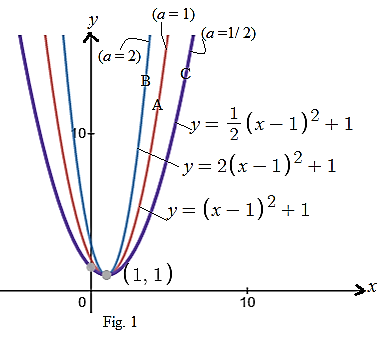
Observe the graphs of functions
b.
To explain: The minimum number of data points to find a single quadratic model,
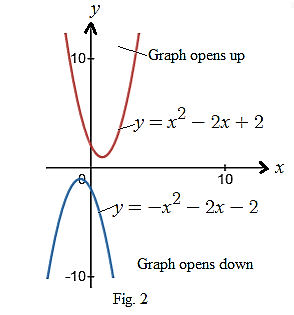
The graph of the function
Given:
There is a relationship of ‘ a’ and
Method used:
The quadric function
Explanation: Observe graphs of the function
Chapter 4 Solutions
High School Math 2015 Common Core Algebra 2 Student Edition Grades 10/11

 Algebra and Trigonometry (6th Edition)AlgebraISBN:9780134463216Author:Robert F. BlitzerPublisher:PEARSON
 Contemporary Abstract AlgebraAlgebraISBN:9781305657960Author:Joseph GallianPublisher:Cengage Learning
 Linear Algebra: A Modern IntroductionAlgebraISBN:9781285463247Author:David PoolePublisher:Cengage Learning
 Algebra And Trigonometry (11th Edition)AlgebraISBN:9780135163078Author:Michael SullivanPublisher:PEARSON
 Introduction to Linear Algebra, Fifth EditionAlgebraISBN:9780980232776Author:Gilbert StrangPublisher:Wellesley-Cambridge Press
 College Algebra (Collegiate Math)AlgebraISBN:9780077836344Author:Julie Miller, Donna GerkenPublisher:McGraw-Hill Education