
Concept explainers
Videos
LINKING concepts... For Individual or Group Explorations
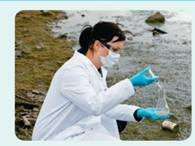
A Logarithmic Model for Water Quality
The United Slates Geological Survey measures the quality of a water sample by using the diversity index d, given by
d = – [p1• log2(p1) + P2 • log2(p2) + • • • + pn • log2(pn)],
where n is the number of different taxons (biological classifications) represented in the sample and p1 through pn are the percentages of organisms in each of the n taxons. For example, if 10% of the organisms in a water sample are E. coli and 90% are fecal coliform, then
d = –[0.1 • log2(0.l) + 0.9 • log2(0.9)] ≈ 0.5.
a) Find the value of d when the only organism found in a sample is the E. coli bacterium.
b) Let n = 3 in the formula and write the diversity index as a single logarithm.
c) If a water sample is found to contain 20% of its organisms of one type, 30% of another type, and 50% of a third type, then what is the diversity index for the water sample?
d) If the organisms in a water sample are equally distributed among 100 different taxons, then what is the diversity index?
e) If 99% of the organisms in a water sample are from one taxon and the other 1% are equally distributed among 99 other taxons, then what is the diversity index?
f) The diversity index can be found for populations other than organisms in a water sample. Find the diversity index for the dogs in the movie 101 Dalmatians (cartoon version).
g) Identify a population of your choice and different classifications within the population. (For example, the trees on campus can be classified as pine, maple, spruce, or elm.) Gather real data and calculate the diversity index for your population.
Want to see the full answer?
Check out a sample textbook solution
Chapter 4 Solutions
College Algebra (6th Edition)


- What does the y -intercept on the graph of a logistic equation correspond to for a population modeled by that equation?arrow_forwardRespiratory Rate Researchers have found that the 95 th percentile the value at which 95% of the data are at or below for respiratory rates in breath per minute during the first 3 years of infancy are given by y=101.82411-0.0125995x+0.00013401x2 for awake infants and y=101.72858-0.0139928x+0.00017646x2 for sleeping infants, where x is the age in months. Source: Pediatrics. a. What is the domain for each function? b. For each respiratory rate, is the rate decreasing or increasing over the first 3 years of life? Hint: Is the graph of the quadratic in the exponent opening upward or downward? Where is the vertex? c. Verify your answer to part b using a graphing calculator. d. For a 1- year-old infant in the 95 th percentile, how much higher is the walking respiratory rate then the sleeping respiratory rate? e. f.arrow_forwardTable 6 shows the population, in thousands, of harbor seals in the Wadden Sea over the years 1997 to 2012. a. Let x represent time in years starting with x=0 for the year 1997. Let y represent the number of seals in thousands. Use logistic regression to fit a model to these data. b. Use the model to predict the seal population for the year 2020. c. To the nearest whole number, what is the limiting value of this model?arrow_forward
 Calculus For The Life SciencesCalculusISBN:9780321964038Author:GREENWELL, Raymond N., RITCHEY, Nathan P., Lial, Margaret L.Publisher:Pearson Addison Wesley,
 Algebra & Trigonometry with Analytic GeometryAlgebraISBN:9781133382119Author:SwokowskiPublisher:Cengage
 Functions and Change: A Modeling Approach to Coll...AlgebraISBN:9781337111348Author:Bruce Crauder, Benny Evans, Alan NoellPublisher:Cengage Learning