Concept explainers
Videos
LINKING
concepts...
For Individual or Group Explorations
Modeling Life Expectancy
The accompanying table gives the life expectancy at birth for U.S. men and women (Centers for Disease Control, www.cdc.gov).
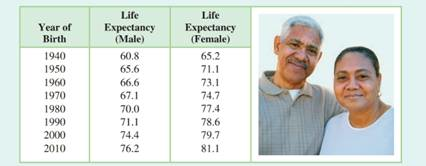
a) Use linear regression on your graphing calculator to find the life expectancy for men as a function of the year of birth.
b) Use linear regression on your graphing calculator to find the life expectancy for women as a function of the year of birth.
c) Graph the functions that you found in parts (a) and (b) on the same
d) According to this model, will men ever catch up to women in life expectancy?
e) For what year of birth did men and women have the same life expectancy?
f) Interpret the slope of these two lines.
g) Why do you think that life expectancy for women is increasing at a greater rate than life expectancy for men?
Want to see the full answer?
Check out a sample textbook solution
Chapter 5 Solutions
College Algebra (6th Edition)


- What is regression analysis? Describe the process of performing regression analysis on a graphing utility.arrow_forwardUsing your graphing calculator, make a scatter plot of the data from the table. Then graph your model from Question 2 along with the data. How well does your model fit the data? What could you do to try to improve your model?arrow_forwardDemand for Candy Bars In this problem you will determine a linear demand equation that describes the demand for candy bars in your class. Survey your classmates to determine what price they would be willing to pay for a candy bar. Your survey form might look like the sample to the left. a Make a table of the number of respondents who answered yes at each price level. b Make a scatter plot of your data. c Find and graph the regression line y=mp+b, which gives the number of respondents y who would buy a candy bar if the price were p cents. This is the demand equation. Why is the slope m negative? d What is the p-intercept of the demand equation? What does this intercept tell you about pricing candy bars? Would you buy a candy bar from the vending machine in the hallway if the price is as indicated. Price Yes or No 50 75 1.00 1.25 1.50 1.75 2.00arrow_forward
- Life Expectancy The following table shows the average life expectancy, in years, of a child born in the given year42 Life expectancy 2005 77.6 2007 78.1 2009 78.5 2011 78.7 2013 78.8 a. Find the equation of the regression line, and explain the meaning of its slope. b. Plot the data points and the regression line. c. Explain in practical terms the meaning of the slope of the regression line. d. Based on the trend of the regression line, what do you predict as the life expectancy of a child born in 2019? e. Based on the trend of the regression line, what do you predict as the life expectancy of a child born in 1580?2300arrow_forwardDoes Table 1 represent a linear function? If so, finda linear equation that models the data.arrow_forwardHOW DO YOU SEE IT? Discuss how well a linear model approximates the data shown in each scatter plot.arrow_forward
 Functions and Change: A Modeling Approach to Coll...AlgebraISBN:9781337111348Author:Bruce Crauder, Benny Evans, Alan NoellPublisher:Cengage Learning
 Calculus For The Life SciencesCalculusISBN:9780321964038Author:GREENWELL, Raymond N., RITCHEY, Nathan P., Lial, Margaret L.Publisher:Pearson Addison Wesley,
 Algebra and Trigonometry (MindTap Course List)AlgebraISBN:9781305071742Author:James Stewart, Lothar Redlin, Saleem WatsonPublisher:Cengage Learning
 Glencoe Algebra 1, Student Edition, 9780079039897...AlgebraISBN:9780079039897Author:CarterPublisher:McGraw Hill
 Trigonometry (MindTap Course List)TrigonometryISBN:9781305652224Author:Charles P. McKeague, Mark D. TurnerPublisher:Cengage Learning