Horngren's Financial & Managerial Accounting, The Managerial Chapters (6th Edition)
6th Edition
ISBN: 9780134486857
Author: Tracie L. Miller-Nobles, Brenda L. Mattison, Ella Mae Matsumura
Publisher: PEARSON
expand_more
expand_more
format_list_bulleted
Videos
Textbook Question
Chapter D, Problem 36BP
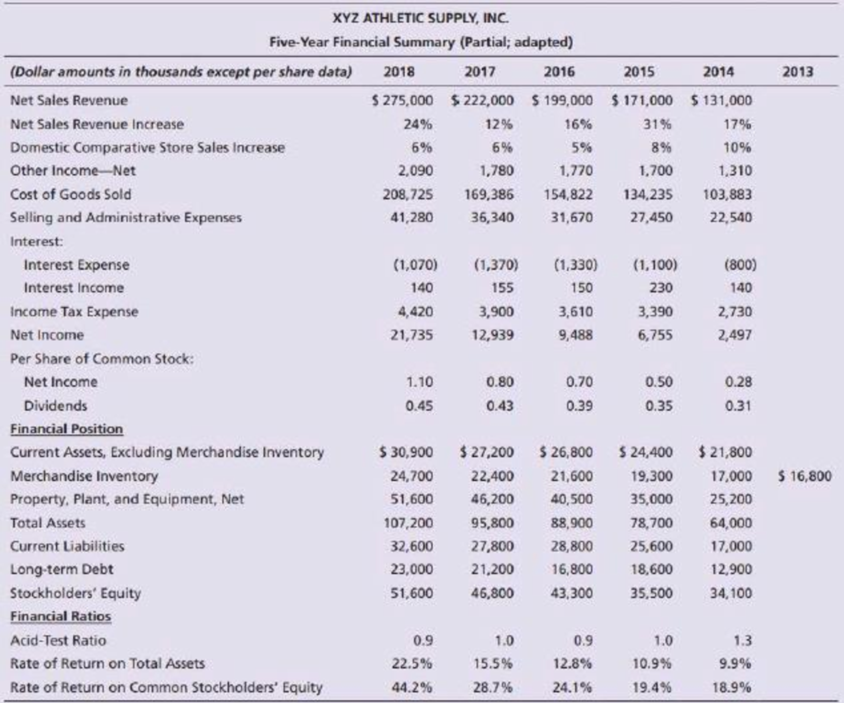
In its annual report, XYZ Athletic Supply, Inc. includes the following five-year financial summary:
Requirements
Analyze the company’s financial summary for the fiscal years 2014–2018 to decide whether to invest in the common stock of XYZ. Include the following sections in your analysis.
- 1. Trend analysis for net sales revenue and net income (use 2014 as the base year).
- 2. Profitability analysis.
- 3. Evaluation of the ability to sell merchandise inventory.
- 4. Evaluation of the ability to pay debts.
- 5. Evaluation of dividends.
- 6. Should you invest in the common stock of XYZ Athletic Supply, Inc.? Fully explain your final decision
Expert Solution & Answer
Want to see the full answer?
Check out a sample textbook solution
Students have asked these similar questions
You are given the financial statements of a company for over the 6-year periods (2016 –2021).
Considering 2016 as the base year, compute the trend index for the following items:a. Revenue, cost of goods sold, total expenses and net earnings. Comment on the trends of each of the items.b. Total assets, total liabilities and shareholders’ equity. Comment on the trends of each of the items.c. Cash flow from operation, cash flow from investing, cash flow from financing and closing cash balances. Comment on the trends of each of the items.
Net sales revenue, net income, and common stockholders' equity for Eyesight Mission Corporation, a manufacturer of contact lenses, follow for a four-year period.
E (Click the icon to view the net sales revenue, net income, and common equity)
Read the requirements.
Requirement 1. Compute trend analyses for each item for 2017-2019. Use 2016 as the base year, and round to the nearest whole percent.
Begin by computing Eyesight Mission Corporation's trend analysis for net sales revenue, then compute Eyesignt Mission Corporation's trend analysis for net income and finally compute Eyesight Mission Corporation's trend analysis for com
2019
2018
2017
2016
Net Sales Revenue
766,000
708,000
644.000
664,000
Trend Percentages
115 %
107 %
97 %
100 %
Net Income
60,000
$4
38,000 $
36.000
2.
44.000
Trend Percentages
136 %
86 %
82 %
100 %
Ending Common Stockholdors' Equity
368,000
352 000 $
326,000 $ 296,000
Trend Percentages
124 %
119 %
110
100 %
% OTI
Requirement 2. Compute the rate of return on…
Obtain Target Corporation's annual report for its 2018 fiscal year (year ended February 2, 2019) at http://investors.target.com
a. What was Target's gross margin percentage for the fiscal year ended February 2, 2019 (2018) and 2017? Use "Sales" for these computations
b. What was Target's Return on Sales percentage for 2018 and 2017? Use "Total Revenue" for these computations.
c. Target's return on ales percentage for 2017 was higher than it was in 2018. Ignoring taxes, how much higher would Target's 2018 net income have been if it's return on sales percentage in 2018 had been the same as for 2017?
Chapter D Solutions
Horngren's Financial & Managerial Accounting, The Managerial Chapters (6th Edition)
Ch. D - Prob. 1TICh. D - Prob. 2TICh. D - Prob. 3TICh. D - Prob. 4TICh. D - Prob. 5TICh. D - Prob. 6TICh. D - Prob. 7TICh. D - Prob. 8TICh. D - Prob. 9TICh. D - Prob. 10TI
Ch. D - Prob. 1QCCh. D - Prob. 2QCCh. D - Vertical analysis of Libertys balance sheet for...Ch. D - Prob. 4QCCh. D - Libertys inventory turnover during 2019 was...Ch. D - Prob. 6QCCh. D - Prob. 7QCCh. D - Prob. 8QCCh. D - Prob. 9QCCh. D - Prob. 10QCCh. D - Prob. 1RQCh. D - Prob. 2RQCh. D - Prob. 3RQCh. D - Prob. 4RQCh. D - Prob. 5RQCh. D - Prob. 6RQCh. D - Prob. 7RQCh. D - Prob. 8RQCh. D - Prob. 9RQCh. D - Prob. 10RQCh. D - Prob. 11RQCh. D - Prob. 12RQCh. D - Prob. 13RQCh. D - Prob. 1SECh. D - Verifine Corp. reported the following on its...Ch. D - Prob. 3SECh. D - Prob. 4SECh. D - Prob. 5SECh. D - Prob. 6SECh. D - Prob. 7SECh. D - Accels Companies, a home improvement store chain,...Ch. D - Prob. 9SECh. D - Prob. 10SECh. D - Prob. 11SECh. D - Prob. 12SECh. D - Prob. 13ECh. D - Prob. 14ECh. D - Prob. 15ECh. D - Refer to the data presented for Mulberry Designs,...Ch. D - Prob. 17ECh. D - Prob. 18ECh. D - Prob. 19ECh. D - Micatin, Inc.s comparative income statement...Ch. D - Prob. 21ECh. D - Prob. 22ECh. D - Prob. 23APCh. D - Prob. 24APCh. D - Prob. 25APCh. D - Prob. 26APCh. D - Comparative financial statement data of Sanfield,...Ch. D - Prob. 28APCh. D - Prob. 29APCh. D - Prob. 30BPCh. D - Prob. 31BPCh. D - Prob. 32BPCh. D - Prob. 33BPCh. D - Prob. 34BPCh. D - Prob. 35BPCh. D - In its annual report, XYZ Athletic Supply, Inc....Ch. D - Prob. 38PCh. D - Lance Berkman is the controller of Saturn, a dance...Ch. D - Prob. 1EICh. D - Prob. 1FSC
Knowledge Booster


Learn more about
Need a deep-dive on the concept behind this application? Look no further. Learn more about this topic, accounting and related others by exploring similar questions and additional content below.Similar questions
- Net sales revenue, net income, and common stockholders' equity for Eyesight Mission Corporation, a manufacturer of contact lenses, follow for a four-year period. E (Click the icon to view the net sales revenue, net income, and common equity) Read the requirements. Requirement 1. Compute trend analyses for each item for 2017 2019 Use 2016 as the base year, and round to the nearest whole percent. Begin by computing Eyesight Mission Corporation's trend analysis for net sales revenue, then compute Eyesight Mission Corporation's trend analysis for net income and finally compute Eyesight Mission Corporation's trend analysis for common stockholders' equity 2019 2018 2017 2016 Net Sales Revenue $4 766,000 $4 708 000 644 000 664,000 Trend Percentages 100 % Requirements 2019 2018 2017 2016 766,000 $ 708,000 $ 644,000 $ 664,000 44,000 Net Sales Revenue $4 Net Income 60,000 38,000 36,000 Ending Common Stockholders' Equity 368,000 352,000 326,000 296,000arrow_forwardAccess the February 21, 2017, filing of the December 31, 2016, 10-K report of The Hershey Company (ticker: HSY) at SEC.gov and complete the following requirements. Required Compute or identify the following profitability ratios of Hershey for its years ending December 31, 2016, and December 31, 2015. Interpret its profitability using the results obtained for these two years. 1. Profit margin ratio (round the percent to one decimal). 2. Gross profit ratio (round the percent to one decimal). 3. Return on total assets (round the percent to one decimal). (Total assets at year-end 2014 were $5,622,870 in thousands.) 4. Return on common stockholders’ equity (round the percent to one decimal). (Total shareholders’ equity at year-end 2014 was $1,519,530 in thousands.) 5. Basic net income per common share (round to the nearest cent).arrow_forwardHelp me pleasearrow_forward
- River Valley Production Inc. seeks to increase its market share and improve its results. The company takes as a starting point the current scenario and the results obtained in 2018 and 2019. Like other companies, River Valley uses financial ratios (ratios) as tools for analyzing the results obtained at the end of the period. Consider the data presented in the financial statements below and analyze the company's results based on the financial ratios.1. Use the financial statements to calculate the following financial ratios for the years 2018 and 2019:1.1 Current Ratio1.2 Quick Ratio1.3 Inventory Turnover Ratio 1.4 Days Sales Outstanding (DSO)1.5 Assets Turnover Ratio1.6 Return on Assets (ROA)1.7 Return on Equity (ROE)1.8 Return on Investment (ROI)1.9 Profit Margin1.10 Debt to Equity Ratio1.11 Price/Earning Ratio Balance Sheet 2018 2019 Cash $63,000 $201,000 Accounts Receivable 199,000 305,000 Marketable Securities 81,000 42,000 Inventories…arrow_forwardRiver Valley Production Inc. seeks to increase its market share and improve its results. The company takes as a starting point the current scenario and the results obtained in 2018 and 2019. Like other companies, River Valley uses financial ratios (ratios) as tools for analyzing the results obtained at the end of the period. Consider the data presented in the financial statements below and analyze the company's results based on the financial ratios.1. Use the financial statements to calculate the following financial ratios for the years 2018 and 2019:1.8 Return on Investment (ROI)1.9 Profit Margin1.10 Debt to Equity Ratio1.11 Price/Earning Ratio Balance Sheet 2018 2019 Cash $63,000 $201,000 Accounts Receivable 199,000 305,000 Marketable Securities 81,000 42,000 Inventories 441,000 455,000 Prepaids 5,000 9,000 Total Current Assets 789,000 1,012,000 Property, Plant, and Equipment, net 858,000 858,000…arrow_forwardRiver Valley Production Inc. seeks to increase its market share and improve its results. The company takes as a starting point the current scenario and the results obtained in 2018 and 2019. Like other companies, River Valley uses financial ratios (ratios) as tools for analyzing the results obtained at the end of the period. Consider the data presented in the financial statements below and analyze the company's results based on the financial ratios.1. Use the financial statements to calculate the following financial ratios for the years 2018 and 2019: 1.1 Days Sales Outstanding (DSO)1.2 Assets Turnover Ratio1.3 Return on Assets (ROA)1.4 Return on Equity (ROE) Balance Sheet 2018 2019 Cash $63,000 $201,000 Accounts Receivable 199,000 305,000 Marketable Securities 81,000 42,000 Inventories 441,000 455,000 Prepaids 5,000 9,000 Total Current Assets 789,000 1,012,000 Property, Plant, and Equipment, net 858,000 858,000…arrow_forward
- Required: Analyse Delima’s financial statement. Include the following ratios for 2020 and discuss your findings (2019 values are provided for comparison): Current ratio (year 2019 – 92:1) Inventory turnover (year 2019 – 7.2 times) Debt to assets ratio (year 2019 – 82%) Return on assets (year 2019 – 10.8%) Profit margin (year 2019 – 10.0%)arrow_forwardA company’s comparative statements are given below. Please conduct the following analyses: c. Calculate the three profitability ratios for year 2017 and show how ROE can be derived from the DuPont formula for this company. d. What do the analyses tell you about the company’s financial performance?arrow_forwardN1. Account Calculate the following ratios for Lake of Egypt Marina, Inc. as of year-end 2021. (Use sales when computing the inventory turnover and use total stockholders' equity when computing the equity multiplier. Round your answers to 2 decimal places. Use 365 days a year.)arrow_forward
- Using the financiaql statements of Top Glove Corporation Berhad for the year 2020, provide and comment on the following: Calculate the profitability, liquidity and effiency ratios of the Top Glove Corporation Berhad company (use the following ratios: gross profit margin, net profit margin, return on capital employed, quick ratio, current ratio, accounts receivable turnover, accounts payables turnover, inventory turnover) for the year 2019 and 2020.arrow_forwardDirection: The following list of accounts for Pazado, Inc is available at the end of December 2020. Make a summary of Income Statement from the given information below with the following required data. 1. Calculate the turnover/ROI 2. Calculate the consumption of goods for sale 3. Prepare the Income Statement of Pazado, Inc for year 2020. Sales Rent Expense Depreciation Expense Utilities Expense Taxes and Licenses Goods Available for Sale Merchandise, Inventory, January 31 Salaries Expense Freight, out Uncollectible Accounts Sales Discount Sales Returns and Allowance 902,000 30,000 11,250 18,000 15,000 714,900 102,000 50,000 3.920 19,100 5,000 13,000arrow_forwardSearch online for Tesla’s Annual Report for fiscal year 2020 that ended on December 31, 2020. Answer the following questions using the report. What’s Tesla’s current ratio in 2019 and 2020? What does this ratio suggest? What’s Tesla’s net profit margin and gross profit percentage in 2019 and 2020? What’s your interpretation of the trend? What’s Tesla’s return on assets(ROA) and total asset turnover ratio in 2020?arrow_forward
arrow_back_ios
SEE MORE QUESTIONS
arrow_forward_ios
Recommended textbooks for you

 AccountingAccountingISBN:9781337272094Author:WARREN, Carl S., Reeve, James M., Duchac, Jonathan E.Publisher:Cengage Learning,
 Accounting Information SystemsAccountingISBN:9781337619202Author:Hall, James A.Publisher:Cengage Learning,
 Horngren's Cost Accounting: A Managerial Emphasis...AccountingISBN:9780134475585Author:Srikant M. Datar, Madhav V. RajanPublisher:PEARSON
 Intermediate AccountingAccountingISBN:9781259722660Author:J. David Spiceland, Mark W. Nelson, Wayne M ThomasPublisher:McGraw-Hill Education
 Financial and Managerial AccountingAccountingISBN:9781259726705Author:John J Wild, Ken W. Shaw, Barbara Chiappetta Fundamental Accounting PrinciplesPublisher:McGraw-Hill Education
Accounting
Accounting
ISBN:9781337272094
Author:WARREN, Carl S., Reeve, James M., Duchac, Jonathan E.
Publisher:Cengage Learning,
Accounting Information Systems
Accounting
ISBN:9781337619202
Author:Hall, James A.
Publisher:Cengage Learning,
Horngren's Cost Accounting: A Managerial Emphasis...
Accounting
ISBN:9780134475585
Author:Srikant M. Datar, Madhav V. Rajan
Publisher:PEARSON
Intermediate Accounting
Accounting
ISBN:9781259722660
Author:J. David Spiceland, Mark W. Nelson, Wayne M Thomas
Publisher:McGraw-Hill Education
Financial and Managerial Accounting
Accounting
ISBN:9781259726705
Author:John J Wild, Ken W. Shaw, Barbara Chiappetta Fundamental Accounting Principles
Publisher:McGraw-Hill Education
Financial ratio analysis; Author: The Finance Storyteller;https://www.youtube.com/watch?v=MTq7HuvoGck;License: Standard Youtube License