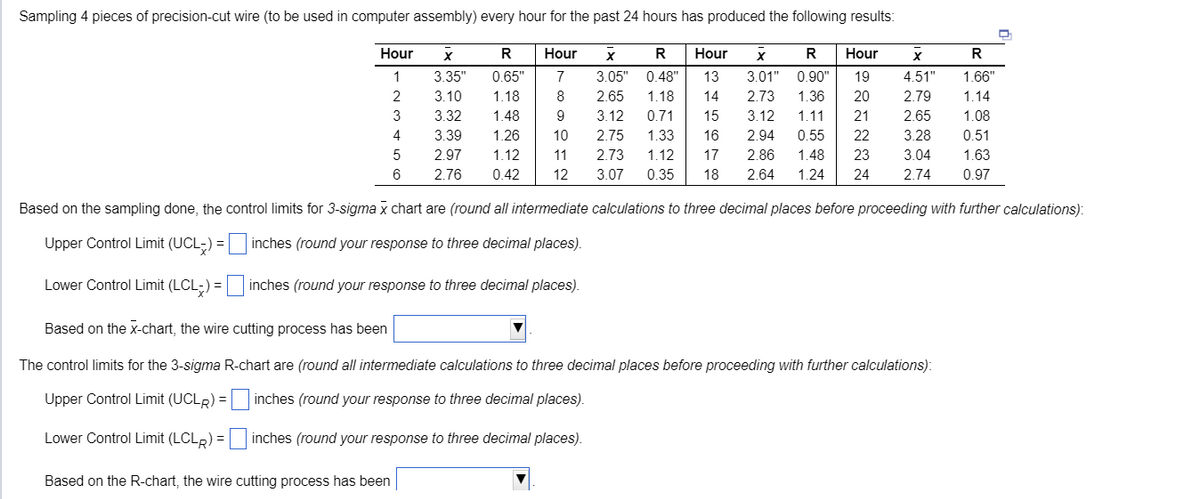
Sampling 4 pieces of precision-cut wire (to be used in computer assembly) every hour for the past 24 hours has produced the following results: Hour Χ R Hour ☑ 1 3.35" 0.65" 7 3.05" 0.48" R Hour 13 x R Hour Χ R 3.01" 0.90" 19 2 3.10 1.18 8 2.65 1.18 14 2.73 1.36 20 3 3.32 1.48 9 3.12 0.71 15 3.12 1.11 4 3.39 1.26 10 2.75 1.33 5 2.97 1.12 6 2.76 0.42 2.86 1.48 23 2.64 1.24 24 2.74 0.97 Based on the sampling done, the control limits for 3-sigma x chart are (round all intermediate calculations to three decimal places before proceeding with further calculations): 11 12 16 2.73 1.12 17 3.07 0.35 18 2.94 0.55 222222 4.51" 1.66" 2.79 1.14 21 2.65 1.08 3.04 3.28 0.51 1.63 Upper Control Limit (UCL) = | inches (round your response to three decimal places). Lower Control Limit (LCL) = inches (round your response to three decimal places). Based on the x-chart, the wire cutting process has been The control limits for the 3-sigma R-chart are (round all intermediate calculations to three decimal places before proceeding with further calculations): Upper Control Limit (UCLR) = Lower Control Limit (LCLR) = inches (round your response to three decimal places). inches (round your response to three decimal places). Based on the R-chart, the wire cutting process has been Sample Size, n Mean Factor, A₂ Upper Range, D4 Lower Range, D3 2 1.880 3.268 0 3 1.023 2.574 0 4 0.729 2.282 0 5 0.577 2.115 0 6 0.483 2.004 0 7 0.419 1.924 0.076 8 0.373 1.864 0.136 9 0.337 1.816 0.184 10 0.308 1.777 0.223 12 0.266 1.716 0.284
Sampling 4 pieces of precision-cut wire (to be used in computer assembly) every hour for the past 24 hours has produced the following results: Hour Χ R Hour ☑ 1 3.35" 0.65" 7 3.05" 0.48" R Hour 13 x R Hour Χ R 3.01" 0.90" 19 2 3.10 1.18 8 2.65 1.18 14 2.73 1.36 20 3 3.32 1.48 9 3.12 0.71 15 3.12 1.11 4 3.39 1.26 10 2.75 1.33 5 2.97 1.12 6 2.76 0.42 2.86 1.48 23 2.64 1.24 24 2.74 0.97 Based on the sampling done, the control limits for 3-sigma x chart are (round all intermediate calculations to three decimal places before proceeding with further calculations): 11 12 16 2.73 1.12 17 3.07 0.35 18 2.94 0.55 222222 4.51" 1.66" 2.79 1.14 21 2.65 1.08 3.04 3.28 0.51 1.63 Upper Control Limit (UCL) = | inches (round your response to three decimal places). Lower Control Limit (LCL) = inches (round your response to three decimal places). Based on the x-chart, the wire cutting process has been The control limits for the 3-sigma R-chart are (round all intermediate calculations to three decimal places before proceeding with further calculations): Upper Control Limit (UCLR) = Lower Control Limit (LCLR) = inches (round your response to three decimal places). inches (round your response to three decimal places). Based on the R-chart, the wire cutting process has been Sample Size, n Mean Factor, A₂ Upper Range, D4 Lower Range, D3 2 1.880 3.268 0 3 1.023 2.574 0 4 0.729 2.282 0 5 0.577 2.115 0 6 0.483 2.004 0 7 0.419 1.924 0.076 8 0.373 1.864 0.136 9 0.337 1.816 0.184 10 0.308 1.777 0.223 12 0.266 1.716 0.284

Practical Management Science
6th Edition
ISBN:9781337406659
Author:WINSTON, Wayne L.
Publisher:WINSTON, Wayne L.
Chapter14: Data Mining
Section14.2: Classification Methods
Problem 11P

Related questions
Question
100%
Transcribed Image Text:Sampling 4 pieces of precision-cut wire (to be used in computer assembly) every hour for the past 24 hours has produced the following results:
Hour
Χ
R
Hour
☑
1
3.35" 0.65"
7
3.05" 0.48"
R Hour
13
x
R Hour
Χ
R
3.01" 0.90" 19
2
3.10
1.18
8
2.65 1.18
14
2.73 1.36 20
3
3.32
1.48
9
3.12 0.71
15
3.12 1.11
4
3.39
1.26
10
2.75 1.33
5
2.97
1.12
6
2.76
0.42
2.86 1.48 23
2.64 1.24 24 2.74 0.97
Based on the sampling done, the control limits for 3-sigma x chart are (round all intermediate calculations to three decimal places before proceeding with further calculations):
11
12
16
2.73 1.12 17
3.07 0.35
18
2.94 0.55
222222
4.51"
1.66"
2.79
1.14
21
2.65
1.08
3.04
3.28 0.51
1.63
Upper Control Limit (UCL) = |
inches (round your response to three decimal places).
Lower Control Limit (LCL) =
inches (round your response to three decimal places).
Based on the x-chart, the wire cutting process has been
The control limits for the 3-sigma R-chart are (round all intermediate calculations to three decimal places before proceeding with further calculations):
Upper Control Limit (UCLR) =
Lower Control Limit (LCLR) =
inches (round your response to three decimal places).
inches (round your response to three decimal places).
Based on the R-chart, the wire cutting process has been
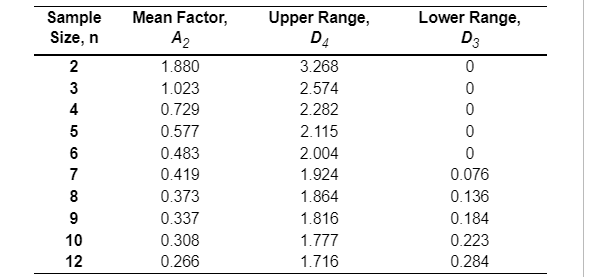
Transcribed Image Text:Sample
Size, n
Mean Factor,
A₂
Upper Range,
D4
Lower Range,
D3
2
1.880
3.268
0
3
1.023
2.574
0
4
0.729
2.282
0
5
0.577
2.115
0
6
0.483
2.004
0
7
0.419
1.924
0.076
8
0.373
1.864
0.136
9
0.337
1.816
0.184
10
0.308
1.777
0.223
12
0.266
1.716
0.284
Expert Solution
This question has been solved!
Explore an expertly crafted, step-by-step solution for a thorough understanding of key concepts.

This is a popular solution!

Trending now
This is a popular solution!

Step by step
Solved in 1 steps

Recommended textbooks for you
Practical Management Science
Operations Management
ISBN:
9781337406659
Author:
WINSTON, Wayne L.
Publisher:
Cengage,
Practical Management Science
Operations Management
ISBN:
9781337406659
Author:
WINSTON, Wayne L.
Publisher:
Cengage,