
Financial And Managerial Accounting
15th Edition
ISBN: 9781337902663
Author: WARREN, Carl S.
Publisher: Cengage Learning,
expand_more
expand_more
format_list_bulleted
Concept explainers
Videos
Textbook Question
Chapter 20, Problem 2E
Identify cost graphs
The following cost graphs illustrate various types of cost behavior:
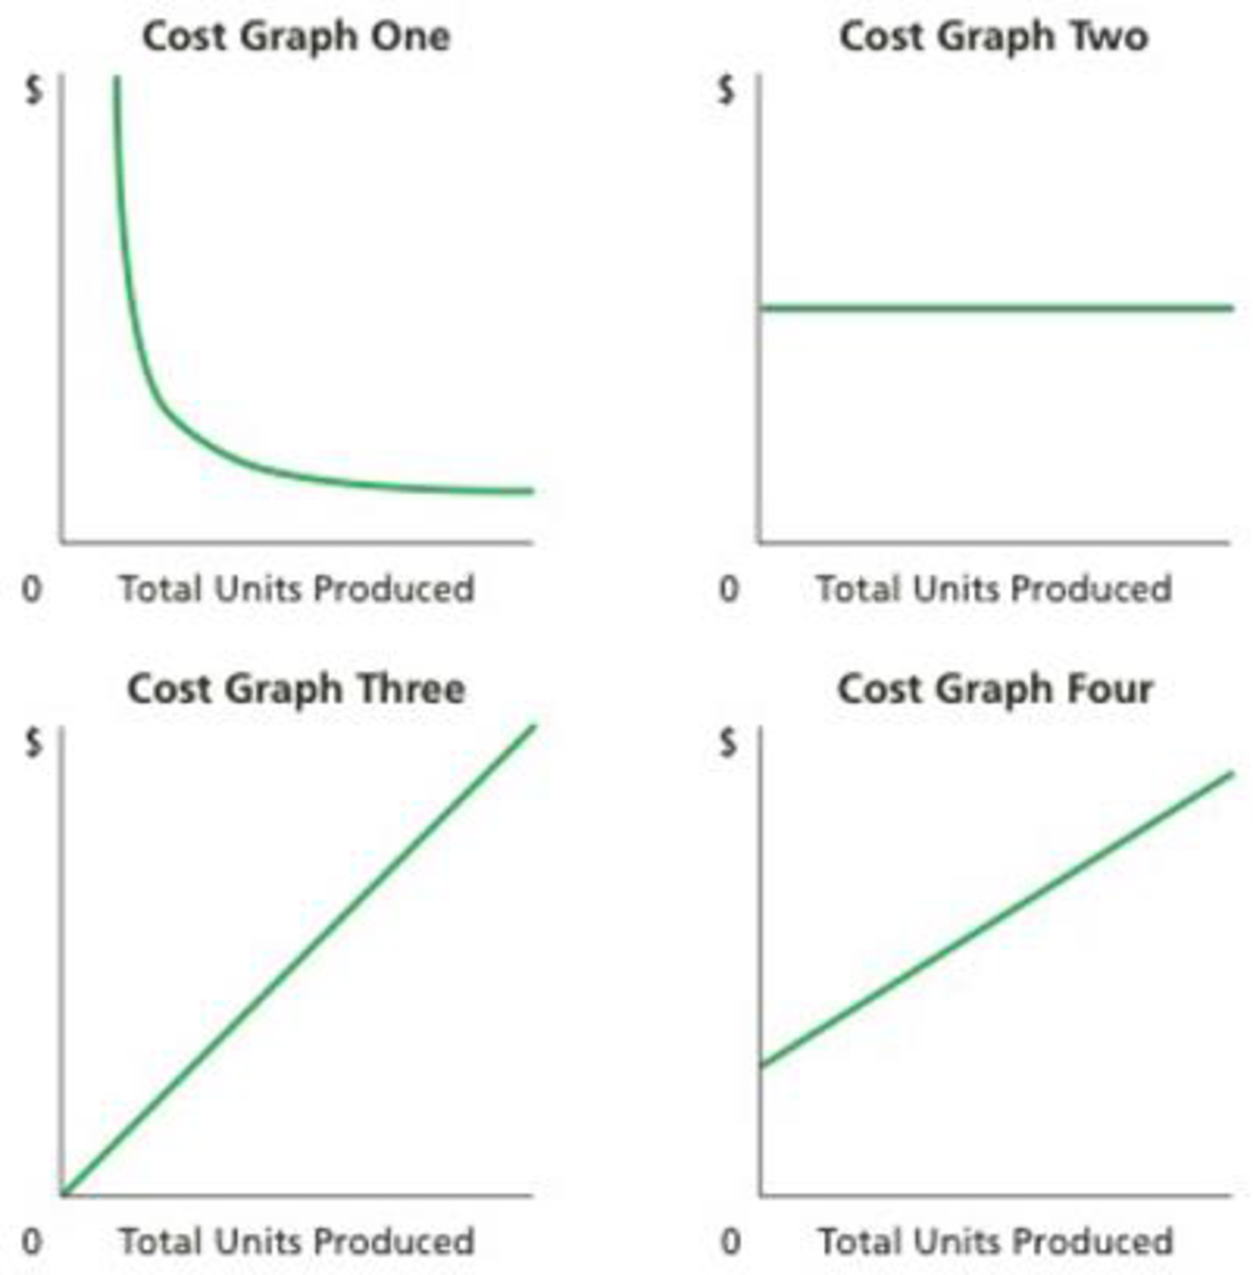
For each of the following costs, identify the cost graph that best illustrates its cost behavior as the number of units produced increases:
- A. Total direct materials cost
- B. Electricity costs of $1,000 per month plus $0.10 per kilowatt-hour
- C. Per-unit cost of straight-line
depreciation on factory equipment - D. Salary of quality control supervisor, $20,000 per month
- E. Per-unit direct labor cost
Expert Solution & Answer

Trending nowThis is a popular solution!

Students have asked these similar questions
Identify cost graphs
The following cost graphs illustrate various types of cost behaviour:
a. Total direct material cost
b. Electricity costs of $1,000 per month plus 50.10 per Kilowatt-hour
c. Per unit cost of straight-line depreciation on factory equipment
d. Salary of quality control superbisor, 520,000 per month
e. Per-unit direct labor cost
Identify cost graphsThe following cost graphs illustrate various types of cost behavior
For each of the following costs, identify the cost graph that best illustrates its costbehavior as the number of units produced increases:A. Total direct materials costB. Electricity costs of $1,000 per month plus $0.10 per kilowatt-hourC. Per-unit cost of straight-line depreciation on factory equipmentD. Salary of quality control supervisor, $20,000 per monthE. Per-unit direct labor cost
Identify cost graphsThe following cost graphs illustrate various types of cost behavior:
a. Total direct materials costb. Electricity costs of $1,000 per month plus 50.10 per kilowatt-hour
c. Per-unit cost of straight-line depreciation on factory equipmentd. Salary of quality control supervisor, 520,000 per monthe. Per-unit direct labor cost
Chapter 20 Solutions
Financial And Managerial Accounting
Ch. 20 - Describe how total variable costs and unit...Ch. 20 - Which of the following costs would be classified...Ch. 20 - Describe how total fixed costs and unit fixed...Ch. 20 - In applying the high-low method of cost estimation...Ch. 20 - If fixed costs increase, what would be the impact...Ch. 20 - Prob. 6DQCh. 20 - Prob. 7DQCh. 20 - Both Austin Company and Hill Company had the same...Ch. 20 - Prob. 9DQCh. 20 - What does operating leverage measure, and how is...
Ch. 20 - High-low method The manufacturing costs of...Ch. 20 - Contribution margin Waite Company sells 250,000...Ch. 20 - Prob. 3BECh. 20 - Prob. 4BECh. 20 - Sales mix and break-even analysis Conley Company...Ch. 20 - Prob. 6BECh. 20 - Margin of safety Jorgensen Company has sales of...Ch. 20 - Classify Costs Following is a list of various...Ch. 20 - Identify cost graphs The following cost graphs...Ch. 20 - Identify activity bases For a major university,...Ch. 20 - Identify activity bases From the following list of...Ch. 20 - Identify fixed and variable costs Intuit Inc....Ch. 20 - Relevant range and fixed and variable costs Child...Ch. 20 - High-low method Ziegler Inc. has decided to use...Ch. 20 - High-low method for a service company Continental...Ch. 20 - Contribution margin ratio Young Company budgets...Ch. 20 - Contribution margin and contribution margin ratio...Ch. 20 - Break-even sales and sales to realize operating...Ch. 20 - Prob. 12ECh. 20 - Prob. 13ECh. 20 - Prob. 14ECh. 20 - Break-even analysis Media outlets such as ESPN and...Ch. 20 - Prob. 16ECh. 20 - Prob. 17ECh. 20 - Prob. 18ECh. 20 - Prob. 19ECh. 20 - Prob. 20ECh. 20 - Prob. 21ECh. 20 - Break-even sales and sales mix for a service...Ch. 20 - Margin of safety A. If Canace Company, with a...Ch. 20 - Prob. 24ECh. 20 - Operating leverage Beck Inc. and Bryant Inc. have...Ch. 20 - Classify costs Seymour Clothing Co. manufactures a...Ch. 20 - Prob. 2PACh. 20 - Prob. 3PACh. 20 - Prob. 4PACh. 20 - Prob. 5PACh. 20 - Contribution margin, break-even sales,...Ch. 20 - Classify costs Cromwell Furniture Company...Ch. 20 - Break-even sales under present and proposed...Ch. 20 - Prob. 3PBCh. 20 - Prob. 4PBCh. 20 - Prob. 5PBCh. 20 - Contribution margin, break-even sales,...Ch. 20 - Prob. 1MADCh. 20 - Prob. 2MADCh. 20 - Prob. 3MADCh. 20 - Break-even number of guests for a theme park...Ch. 20 - Prob. 1TIFCh. 20 - Communication Sun Airlines is a commercial airline...Ch. 20 - Profitability strategies Somerset Inc. has...Ch. 20 - Prob. 5TIFCh. 20 - Analysis of costs for a shipping department Sales...Ch. 20 - Taylor Corporation is analyzing the cost behavior...Ch. 20 - Kimber Company has the following unit costs for...Ch. 20 - Bolger and Co. manufactures large gaskets for the...Ch. 20 - Eagle Brand Inc. produces two products as follows:...
Knowledge Booster


Learn more about
Need a deep-dive on the concept behind this application? Look no further. Learn more about this topic, accounting and related others by exploring similar questions and additional content below.Similar questions
- Cost Classification Loring Company incurred the following costs last year: Required: 1. Classify each of the costs using the following table format. Be sure to total the amounts in each column. Example: Direct materials, 216,000. 2. What was the total product cost for last year? 3. What was the total period cost for last year? 4. If 30,000 units were produced last year, what was the unit product cost?arrow_forwardThe cost behavior patterns below are lettered A through H. The vertical axes of the graphs represent total dollars of expense, and the horizontal axes represent production in units, machine hours, or direct labor hours. In each case, the zero point is at the intersection of the two axes. Each graph may be used no more than once. Required: Select the graph that matches the lettered cost described here. a. Depreciation of equipmentthe amount of depreciation charged is computed based on the number of machine hours that the equipment was operated. b. Electricity billflat fixed charge, plus a variable cost after a certain number of kilowatt hours are used. c. City water billcomputed as follows: d. Depreciation of equipmentthe amount is computed by the straight-line method. e. Rent on a factory building donated by the citythe agreement calls for a fixed fee payment, unless 200,000 labor hours are worked, in which case no rent need be paid. f. Salaries of repair workersone repair worker is needed for every 1,000 machine hours or less (i.e., 0 to 1,000 hours requires one repair worker, 1,001 to 2,000 hours requires two repair workers, etc.).arrow_forwardUsing High-Low to Calculate Predicted Total Variable Cost and Total Cost for a Time Period That Differs from the Data Period Refer to the information for Pizza Vesuvio on the previous page. Assume that this information was used to construct the following formula for monthly labor cost. TotalLaborCost=5,237+(7.40EmployeeHours) Required: Assume that 4,000 employee hours are budgeted for the coming year. Use the total labor cost formula to make the following calculations: 1. Calculate total variable labor cost for the year. 2. Calculate total fixed labor cost for the year. 3. Calculate total labor cost for the coming year. Use the following information for Brief Exercises 3-17 through 3-20: Pizza Vesuvio makes specialty pizzas. Data for the past 8 months were collected:arrow_forward
- Baxter Company has a relevant range of production between 15,000 and 30,000 units. The following cost data represents average variable costs per unit for 25,000 units of production. Using the costs data from Rose Company, answer the following questions: A. If 15,000 units are produced, what is the variable cost per unit? B. If 28,000 units are produced, what is the variable cost per unit? C. If 21,000 units are produced, what are the total variable costs? D. If 29,000 units are produced, what are the total variable costs? E. If 17,000 units are produced, what are the total manufacturing overhead costs incurred? F. If 23,000 units are produced, what are the total manufacturing overhead costs incurred? G. If 30,000 units are produced, what are the per unit manufacturing overhead costs incurred? H. If 15,000 units are produced, what are the per unit manufacturing overhead costs incurred?arrow_forwardHart Manufacturing makes three products. Each product requires manufacturing operations in three departments: A, B, and C. The labor-hour requirements, by department, are as follows: During the next production period the labor-hours available are 450 in department A, 350 in department B, and 50 in department C. The profit contributions per unit are 25 for product 1, 28 for product 2, and 30 for product 3. a. Formulate a linear programming model for maximizing total profit contribution. b. Solve the linear program formulated in part (a). How much of each product should be produced, and what is the projected total profit contribution? c. After evaluating the solution obtained in part (b), one of the production supervisors noted that production setup costs had not been taken into account. She noted that setup costs are 400 for product 1, 550 for product 2, and 600 for product 3. If the solution developed in part (b) is to be used, what is the total profit contribution after taking into account the setup costs? d. Management realized that the optimal product mix, taking setup costs into account, might be different from the one recommended in part (b). Formulate a mixed-integer linear program that takes setup costs provided in part (c) into account. Management also stated that we should not consider making more than 175 units of product 1, 150 units of product 2, or 140 units of product 3. e. Solve the mixed-integer linear program formulated in part (d). How much of each product should be produced and what is the projected total profit contribution? Compare this profit contribution to that obtained in part (c).arrow_forwardRose Company has a relevant range of production between 10,000 and 25.000 units. The following cost data represents average cost per unit for 15,000 units of production. Using the cost data from Rose Company, answer the following questions: If 10,000 units are produced, what is the variable cost per unit? If 18,000 units are produced, what is the variable cost per unit? If 21,000 units are produced, what are the total variable costs? If 11,000 units are produced, what are the total variable costs? If 19,000 units are produced, what are the total manufacturing overhead costs incurred? If 23,000 units are produced, what are the total manufacturing overhead costs incurred? If 19,000 units are produced, what are the per unit manufacturing overhead costs incurred? If 25,000 units are produced, what are the per unit manufacturing overhead costs incurred?arrow_forward
- Scattergraph method Using the data in P4-2 and a piece of graph paper: 1. Plot the data points on the graph and draw a line by visual inspection, indicating the trend shown by the data points. 2. Determine the variable cost per unit and the total fixed cost from the information on the graph. 3. Determine the variable cost to be charged to the product for the year. 4. Determine the fixed cost to be charged to factory overhead for the year. 5. Do these answers agree with the answers to P4-2? Why or why not?arrow_forwardMethod of Least Squares, Predicting Cost for Different Time Periods from the One Used to Develop a Cost Formula Refer to the information for Farnsworth Company on the previous page. However, assume that Tracy has used the method of least squares on the receiving data and has gotten the following results: Required: 1. Using the results from the method of least squares, prepare a cost formula for the receiving activity. 2. Using the formula from Requirement 1, what is the predicted cost of receiving for a month in which 1,450 receiving orders are processed? (Note: Round your answer to the nearest dollar.) 3. Prepare a cost formula for the receiving activity for a quarter. Based on this formula, what is the predicted cost of receiving for a quarter in which 4,650 receiving orders are anticipated? Prepare a cost formula for the receiving activity for a year. Based on this formula, what is the predicted cost of receiving for a year in which 18,000 receiving orders are anticipated?arrow_forwardThe management of Hartman Company is trying to determine the amount of each of two products to produce over the coming planning period. The following information concerns labor availability, labor utilization, and product profitability: a. Develop a linear programming model of the Hartman Company problem. Solve the model to determine the optimal production quantities of products 1 and 2. b. In computing the profit contribution per unit, management does not deduct labor costs because they are considered fixed for the upcoming planning period. However, suppose that overtime can be scheduled in some of the departments. Which departments would you recommend scheduling for overtime? How much would you be willing to pay per hour of overtime in each department? c. Suppose that 10, 6, and 8 hours of overtime may be scheduled in departments A, B, and C, respectively. The cost per hour of overtime is 18 in department A, 22.50 in department B, and 12 in department C. Formulate a linear programming model that can be used to determine the optimal production quantities if overtime is made available. What are the optimal production quantities, and what is the revised total contribution to profit? How much overtime do you recommend using in each department? What is the increase in the total contribution to profit if overtime is used?arrow_forward
- Write a linear cost function equation for each of the following conditions. Use y for estimated costsand X for activity of the cost driver. Machine operating costs include $1,000 of maintenance per month, and $15.00 of coolant usagecosts for each day the machinery is in operation.arrow_forwardThe graphs below represent cost behavior patterns that might occur in a company’s cost structure. The vertical axis represents total cost, and the horizontal axis represents activity output Required:For each of the following situations, choose the graph from the group a–1 that best illustrates the cost pattern involved. Also, for each situation, identify the driver that measures activity output.1. The cost of power when a fixed fee of $500 per month is charged plus an additional charge of $0.12 per kilowatt-hour used.2. Commissions paid to sales representatives. Commissions are paid at the rate of 5 percent of sales made up to total annual sales of $500,000, and 7 percent of sales above $500,000.3. A part purchased from an outside supplier costs $12 per part for the first 3,000 parts and $10 per part for all parts purchased in excess of 3,000 units.4. The cost of surgical gloves, which are purchased in increments of 100 units (gloves come in boxes of 100 pairs).5. The cost of tuition…arrow_forwardWrite a linear cost function equation for each of the following conditions. Use y for estimated costsand X for activity of the cost driver.a. Direct materials cost is $2.70 per pound b. Total cost is fixed at $800 per month regardless of the number of units produced. c. Auto rental has a fixed fee of $90.00 per day plus $1.75 per mile driven. d. Machine operating costs include $1,000 of maintenance per month, and $15.00 of coolant usagecosts for each day the machinery is in operation.arrow_forward
arrow_back_ios
SEE MORE QUESTIONS
arrow_forward_ios
Recommended textbooks for you
- Financial And Managerial AccountingAccountingISBN:9781337902663Author:WARREN, Carl S.Publisher:Cengage Learning,
 Managerial AccountingAccountingISBN:9781337912020Author:Carl Warren, Ph.d. Cma William B. TaylerPublisher:South-Western College Pub
 Principles of Accounting Volume 2AccountingISBN:9781947172609Author:OpenStaxPublisher:OpenStax College
  Managerial Accounting: The Cornerstone of Busines...AccountingISBN:9781337115773Author:Maryanne M. Mowen, Don R. Hansen, Dan L. HeitgerPublisher:Cengage Learning
 Principles of Cost AccountingAccountingISBN:9781305087408Author:Edward J. Vanderbeck, Maria R. MitchellPublisher:Cengage Learning
 Essentials of Business Analytics (MindTap Course ...StatisticsISBN:9781305627734Author:Jeffrey D. Camm, James J. Cochran, Michael J. Fry, Jeffrey W. Ohlmann, David R. AndersonPublisher:Cengage Learning
Financial And Managerial Accounting
Accounting
ISBN:9781337902663
Author:WARREN, Carl S.
Publisher:Cengage Learning,
Managerial Accounting
Accounting
ISBN:9781337912020
Author:Carl Warren, Ph.d. Cma William B. Tayler
Publisher:South-Western College Pub
Principles of Accounting Volume 2
Accounting
ISBN:9781947172609
Author:OpenStax
Publisher:OpenStax College
Managerial Accounting: The Cornerstone of Busines...
Accounting
ISBN:9781337115773
Author:Maryanne M. Mowen, Don R. Hansen, Dan L. Heitger
Publisher:Cengage Learning
Principles of Cost Accounting
Accounting
ISBN:9781305087408
Author:Edward J. Vanderbeck, Maria R. Mitchell
Publisher:Cengage Learning
Essentials of Business Analytics (MindTap Course ...
Statistics
ISBN:9781305627734
Author:Jeffrey D. Camm, James J. Cochran, Michael J. Fry, Jeffrey W. Ohlmann, David R. Anderson
Publisher:Cengage Learning
Cost Accounting - Definition, Purpose, Types, How it Works?; Author: WallStreetMojo;https://www.youtube.com/watch?v=AwrwUf8vYEY;License: Standard YouTube License, CC-BY