a. Calculate the upper and lower control limits for the x bar-chart and the R-chart associated with this data. See below for the table of the D2, D3, and D4 values. b. Plot the x bar-chart and R-chart for Kellogg's cereal production process. You may use the blank charts below to help you. Also determine whether or not Kellogg's process of making cereal is in control. If it is not in control, state everything that looks wrong on either the x bar chart or R-chart. You may use software like Excel for the plots.
a. Calculate the upper and lower control limits for the x bar-chart and the R-chart associated with this data. See below for the table of the D2, D3, and D4 values. b. Plot the x bar-chart and R-chart for Kellogg's cereal production process. You may use the blank charts below to help you. Also determine whether or not Kellogg's process of making cereal is in control. If it is not in control, state everything that looks wrong on either the x bar chart or R-chart. You may use software like Excel for the plots.

Practical Management Science
6th Edition
ISBN:9781337406659
Author:WINSTON, Wayne L.
Publisher:WINSTON, Wayne L.
Chapter2: Introduction To Spreadsheet Modeling
Section: Chapter Questions
Problem 20P: Julie James is opening a lemonade stand. She believes the fixed cost per week of running the stand...

Related questions
Question
help me with Parts A and B
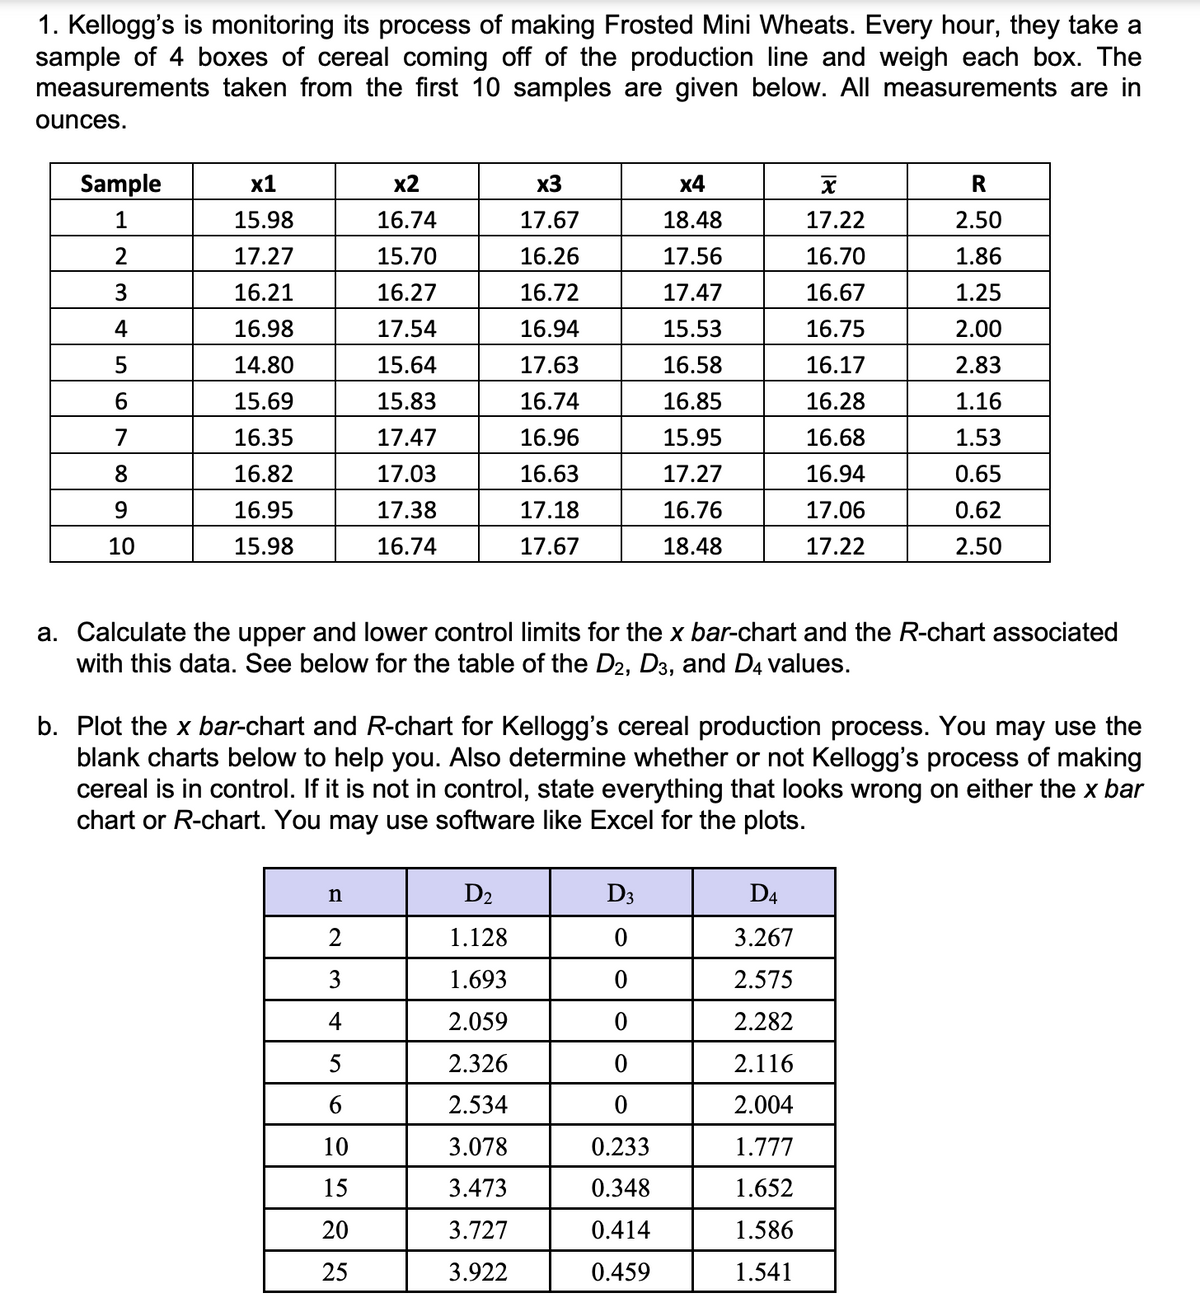
Transcribed Image Text:1. Kellogg's is monitoring its process of making Frosted Mini Wheats. Every hour, they take a
sample of 4 boxes of cereal coming off of the production line and weigh each box. The
measurements taken from the first 10 samples are given below. All measurements are in
ounces.
Sample
x1
x2
x3
x4
x
R
1
15.98
16.74
17.67
18.48
17.22
2.50
2
17.27
15.70
16.26
17.56
16.70
1.86
3
16.21
16.27
16.72
17.47
16.67
1.25
4
16.98
17.54
16.94
15.53
16.75
2.00
5
14.80
15.64
17.63
16.58
16.17
2.83
6
15.69
15.83
16.74
16.85
16.28
1.16
7
16.35
17.47
16.96
15.95
16.68
1.53
8
16.82
17.03
16.63
17.27
16.94
0.65
9
16.95
17.38
17.18
16.76
17.06
0.62
10
15.98
16.74
17.67
18.48
17.22
2.50
a. Calculate the upper and lower control limits for the x bar-chart and the R-chart associated
with this data. See below for the table of the D2, D3, and D4 values.
b. Plot the x bar-chart and R-chart for Kellogg's cereal production process. You may use the
blank charts below to help you. Also determine whether or not Kellogg's process of making
cereal is in control. If it is not in control, state everything that looks wrong on either the x bar
chart or R-chart. You may use software like Excel for the plots.
n
D2
D3
D4
2
1.128
0
3.267
3
1.693
0
2.575
4
2.059
0
2.282
5
2.326
0
2.116
6
2.534
0
2.004
10
3.078
0.233
1.777
15
3.473
0.348
1.652
20
3.727
0.414
1.586
25
3.922
0.459
1.541
Expert Solution
This question has been solved!
Explore an expertly crafted, step-by-step solution for a thorough understanding of key concepts.

This is a popular solution!

Trending now
This is a popular solution!

Step by step
Solved in 6 steps with 7 images

Recommended textbooks for you
Practical Management Science
Operations Management
ISBN:
9781337406659
Author:
WINSTON, Wayne L.
Publisher:
Cengage,

Operations Management
Operations Management
ISBN:
9781259667473
Author:
William J Stevenson
Publisher:
McGraw-Hill Education

Operations and Supply Chain Management (Mcgraw-hi…
Operations Management
ISBN:
9781259666100
Author:
F. Robert Jacobs, Richard B Chase
Publisher:
McGraw-Hill Education
Practical Management Science
Operations Management
ISBN:
9781337406659
Author:
WINSTON, Wayne L.
Publisher:
Cengage,
Operations Management
Operations Management
ISBN:
9781259667473
Author:
William J Stevenson
Publisher:
McGraw-Hill Education
Operations and Supply Chain Management (Mcgraw-hi…
Operations Management
ISBN:
9781259666100
Author:
F. Robert Jacobs, Richard B Chase
Publisher:
McGraw-Hill Education


Purchasing and Supply Chain Management
Operations Management
ISBN:
9781285869681
Author:
Robert M. Monczka, Robert B. Handfield, Larry C. Giunipero, James L. Patterson
Publisher:
Cengage Learning

Production and Operations Analysis, Seventh Editi…
Operations Management
ISBN:
9781478623069
Author:
Steven Nahmias, Tava Lennon Olsen
Publisher:
Waveland Press, Inc.