
Videos
An experiment to investigate the effects of a new technique for degumming of silk yarn was described in the article “Some Studies in Degumming of Silk with Organic Acids” (J. Society of Dyers and Colourists, 1992: 79–86). One response variable of interest was y = weight loss (%). The experimenters made observations on weight loss for various values of three independent variables: x1 = temperature (°C) = 90, 100, 110;x2 = time of treatment (min) = 30, 75, 120; x3 = tartaric acid concentration (g/L) = 0,8,16. In the regression analyses, the three values of each variable were coded as −1, 0, and 1, respectively, giving the accompanying data (the value y8 = 19.3 was reported, but our value y8 = 20.3 results in regression output identical to that appearing in the article).
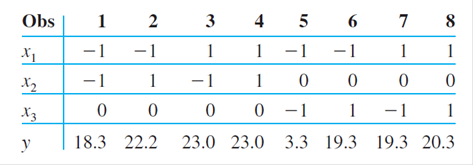
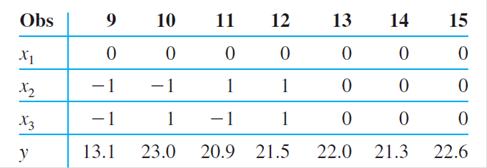
A multiple regression model with k = 9 predictors—x1, x2, x3,
a. Does this model specify a useful relationship? State and test the appropriate hypotheses using a significance level of .01.
b. The estimated standard deviation of
c. Calculate a 95% PI for a single weight-loss value to be observed when temperature, time, and concentration have values 100, 75, and 8, respectively.
d. Fitting the model with only x1, x2, and x3 as predictors gave R2 = .456 and SSE = 203.82. Does at least one of the second-order predictors provide additional useful information? State and test the appropriate hypotheses.
Want to see the full answer?
Check out a sample textbook solution
Chapter 13 Solutions
Probability and Statistics for Engineering and the Sciences


- An article described an experiment in which observations on various characteristics were made using minichambers of three different types: (1) cooler (PVC frames covered with shade cloth), (2) control (PVC frames only), and (3) warmer (PVC frames covered with plastic). One of the article's authors kindly supplied the accompanying data on the difference between air and soil temperatures (°C). Cooler Control Warmer 1.59 1.92 2.57 1.43 2.00 2.60 1.88 2.19 1.93 1.26 1.12 1.58 1.91 1.78 2.30 1.86 1.84 0.84 1.90 2.45 2.65 1.57 2.03 0.12 1.79 1.52 2.74 1.72 0.58 2.53 2.41 1.90 2.13 2.34 2.86 0.96 2.31 1.34 1.91 1.76 (a) Compare measures of center for the three different samples. Cooler=_____________ Control=____________ Warmer=____________ (b) Calculate the standard deviations for the three different samples. (Round your answers to three decimal places.) Coolers=_______________ Controls=______________ Warmers=______________…arrow_forwardThe paper "The Relationship Between Cell Phone Use, Academic Performance, Anxiety, and Satisfaction with Life in College Students"† described a study of cell phone use among undergraduate college students at a public university. The paper reported that the value of the correlation coefficient between x = cell phone use (measured as total amount of time (in hours) spent using a cell phone on a typical day) and y = GPA (cumulative GPA determined from university records) was r = −0.203.(a) Interpret the given value of the correlation coefficient. Does the value of the correlation coefficient suggest that students who use a cell phone for more hours per day tend to have higher GPAs or lower GPAs? The value of the correlation coefficient is , which suggests that students who use a cell phone for more hours per day tend to have GPA's. (b) The study also investigated the correlation between texting (measured as the total number of texts sent and texts received per day) and GPA. The direction…arrow_forwardFind the correlation coefficient between the “modules studied in the last semester and number of hours spend on reading the books” from your collected data.arrow_forward
- The article "Behavioural Effects of Mobile Telephone Use During Simulated Driving" + reported that for a sample of 20 experimental subjects, the sample correlation coefficient for x = age and y = time since the subject had acquired a driving license (yr) was 0.97. Why do you think the value of r is so close to 1? (The article's authors give an explanation.) O The younger a subject is, the more time since they acquired their license. O The older a subject is, the less time since they acquired their license. O The older a subject is, the more time since they acquired their license. O This is a mistake. The value should be close to -1. O This is a mistake. The value should be close to 0.arrow_forwardA study was conducted to examine the effect of diet cola consumption on calcium levels in women. A sample of 16 healthy women aged 18 to 40 were randomly assigned to drink 24 ounces of either diet cola or water. Their urine was collected for three hours after ingestion of the beverage and calcium excretion (in mg) was measured. The data are stored in ColaCalcium.arrow_forwardThe Lion’sMane. In a study by P. M.West titled “The Lion’s Mane” (American Scientist, Vol. 93, No. 3, pp. 226–236), the effects of the mane of a male lion as a signal of quality to mates and rivals was explored. Four life-sized dummies of male lions provided a tool for testing female response to the unfamiliar lions whose manes varied by length (long or short) and color (blonde or dark). The female lions were observed to see whether they approached each of the four life-sized dummies. a. experimental units. b. response variable. c. factor(s). d. levels of each factor. e. treatments.arrow_forward
- A researcher conducted a Pearson's r test to examine the relationship between study hours and exam scores for a sample of 50 students. The resulting Pearson's r value was 0.6. Can the researcher conclude that there is a strong positive relationship between study hours and exam scores in the population?arrow_forwardThe correlation between height and weight of a sample of 100 individuals is calculated to be 0.8 using Pearson's r. What can we conclude about the relationship between height and weight in the population from which the sample was taken?arrow_forwardA medical student at a community college in city Q wants to study the factors affecting the systolic blood pressure of a person (Y) Generally, the systolic blood pressure depends on the BMI of a person (B) and the age of the person A. She wants to test whether or not the BMI has a significant effect on the systolic blood pressure, keeping the age of the person constant. For her study, she collects a random sample of 125 patients from the city and estimates the following regression function: Y= 15.50 + 0..90B+1.15A. (0.55) (0 40) The test statistic of the study the student wants to conduct (Ho: B, = 0 vs. H, B, #0), keeping other variables constant is. (Round your answer to two decimal places.) At the 5% significance level, the student will ▼ the null hypothesis. Keeping BMIl constant, she now wants to test whether the age of a person (A) has no significant effect or a positive effect on the person's systolic blood pressure. So, the test statistic associated with the one-sided test the…arrow_forward
- A sample of 25 individuals was taken to investigate the relationship between their annual income and number of years of education. The Pearson's correlation coefficient (r) was calculated to be 0.6. Test the hypothesis at a significance level of 0.01 that the population correlation coefficient is different from 0.arrow_forwardA methodological study had established values for the MIC on a scale that measured physical function: The MIC for improvement (higher scores) was 4.0, and the MIC for deterioration (lower scores) was 3.0. Lawrence studied clinically significant change in physical functioning over a 1-year period for a sample of 100 patients with COPD. Some change score information is presented below for 10 patients. Which patients experienced clinically significant change in physical function in the 12-month period between assessments? Patient Baseline Score* 12-Month Score* 1 19 15 2 12 10 3 16 14 4 17 16 5 9 10 6 11 12 7 13 17 8 15 13 9 18 14 10 16 9 *Higher scores = higher level of physical function Which patients had clinically significant deterioration? Which patients had clinically significant improvement? Which patients had no clinically significant change?arrow_forwardThe state of California is working very hard to ensure that all elementary age students whose native language is not English become proficient in English by the sixth grade. Their progress is monitored each year using the California English Language Development test. The results for two school districts in southern California for the 2003 school year are given in the accompanying table.7 Do the data indicate a significant difference in the 2003 proportions of students who are fluent in English for the two districts? Use α = .01.arrow_forward
 Calculus For The Life SciencesCalculusISBN:9780321964038Author:GREENWELL, Raymond N., RITCHEY, Nathan P., Lial, Margaret L.Publisher:Pearson Addison Wesley,
 Glencoe Algebra 1, Student Edition, 9780079039897...AlgebraISBN:9780079039897Author:CarterPublisher:McGraw Hill
 Big Ideas Math A Bridge To Success Algebra 1: Stu...AlgebraISBN:9781680331141Author:HOUGHTON MIFFLIN HARCOURTPublisher:Houghton Mifflin Harcourt