
Concept explainers
Videos
Detecting gender-related employment disparities. In the Federal Reserve Bank of Atlanta, Working Paper Series (October 2008), researchers presented a novel approach to identifying firms that discriminate against women. The researchers used the Equal Employment Opportunity (EEOC) Systematic Gender Disparity Scorecard as a measure of the degree to which a firm complies with EEOC guidelines for eliminating gender bias. (EEOC Scorecard values
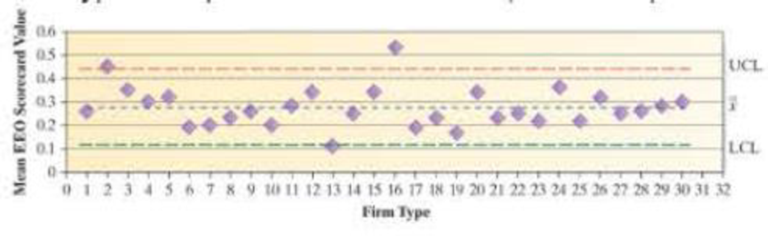
Control chart for Exercise 13.14
- a. Identify the rational subgroups used to construct the chart.
- b. Identify the key variable plotted on the chart.
- c. What are the approximate values of
- d. What conclusions can you draw from the chart? Are there any firm types that should concern the EEOC? Why?
Want to see the full answer?
Check out a sample textbook solution
Chapter 13 Solutions
Statistics for Business and Economics (13th Edition)


- What is meant by the sample space of an experiment?arrow_forwardIn determining the best companies to work for, a number of variables are considered, including size, average annual pay, and employee turnover rate. Moreover, employee surveys are conducted to assess aspects of the organization's culture, such as trust and openness to change. In an attempt to determine what affects turnover rate, a sample of 33 companies was randomly selected, and data were collected on the average annual bonus and turnover rate (%) for 2008. In addition, a questionnaire was administered to the employees of each company to arrive at a trust index (measured on a scale of 0-100). Below are the multiple regression results. Predictor Coef SE Coef T P R-square Constant 12.1005 0.7826 15.46 0.000 79.6% Trust Index -0.07149 0.01966 -3.64 0.001 Average Bonus -0.0007216 0.0001481 -4,87 0.000 The correct null hypotheses for testing the regression coefficient of Trust Index (TI) is βTI ≠ 0…arrow_forwardCybersecurity is a critical business issue that demands the attention of business and IT executives. According to a study released by PwC, 38% of surveyed business and IT executives reported phishing scams at their institutions.Source: Data extracted from “Toward new possibilities in threat management,” PwC, 2017 pwc.to/2kwhPJv. a. If you conduct a follow-up study to estimate the population proportion of business and IT executives reporting phishing scams at their institutions, would you use a p of 0.38 or 0.50 in the sample size formula? b. Using your answer in part (a), find the sample size necessary to estimate, with 95% confidence, the population proportion to within 0.03.arrow_forward
- According to the February 2008 Federal Trade Commission report on consumer fraud and identity theft, 23% of all complaints in 2007 were for identity theft. In that year, Arkansas had 1,601 complaints of identity theft out of 3,482 consumer complaints ("Consumer fraud and," 2008). Do these data provide enough evidence to show that Arkansas had a higher proportion of identity theft than 23%? Test at the 5% level.arrow_forwardIn which situation would a researcher need to use a one-way independent measures ANOVA to analyze the data? a. A researcher is interested in whether a sensitivity training class changes attitudes toward minority populations and assesses these attitudes before and after the sensitivity training class. b. A researcher is interested in the effects of distraction on driving performance and randomly assigns participants to one of three distraction groups. c. A researcher is interested in a longitudinal study that follows a group of kindergarten children through high school and assesses their body mass index at four time points. d. A researcher classifies a group of college students on the basis of their political leanings as Liberal, Conservative, NDP, or PQ.arrow_forward1. Which of the following is most likely to be an independent-measures design? a. A study evaluating jet lag by comparing cognitive performance at the beginning and at the end of a cross-country flight b. A study comparing blood pressure before and after a workout (incorrect answer) c. A study comparing classroom learning with and without background music d. A study comparing self-esteem for children from single-parent homes and children from two-parent homesarrow_forward
 Glencoe Algebra 1, Student Edition, 9780079039897...AlgebraISBN:9780079039897Author:CarterPublisher:McGraw Hill
 Big Ideas Math A Bridge To Success Algebra 1: Stu...AlgebraISBN:9781680331141Author:HOUGHTON MIFFLIN HARCOURTPublisher:Houghton Mifflin Harcourt
 College Algebra (MindTap Course List)AlgebraISBN:9781305652231Author:R. David Gustafson, Jeff HughesPublisher:Cengage Learning