
Concept explainers
Videos
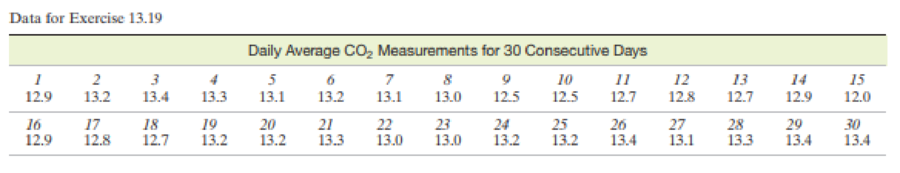
Detecting under-reported emissions. The Environmental Protection Agency EPA) regulates the level of carbon dioxide (CO2) emissions. Periodically these emissions measurements are under-reported due to leakage or faulty equipment. Such problems are often detected only by an expensive test (RATA) that is typically conducted only once per year. Just recently, the EPA began applying an automated control chart methodology to detect under- measurement of emissions data (EFRI CEM Users Group Conference. Nashville. ”N. May 13. 2008). Each day. the EPA collects emissions data by measuring CO2 concentration for each of 6 randomly selected hours. The daily average CO2 levels for each of 30 days are shown in the table at the bottom of the page. The EPA considers these values to truly represent emissions eves because the RATA test was recently performed and showed no problems with under-reporting. The lower and upper control limits for the averages were established as LCL = 12.26 and UCL = 13.76.
- a. Construct a control chart for the daily average CO2 levels.
- b. Based on the control chart, describe the behavior of the measurement process.
- c. The following average CO2 levels were determined for a later 10-day period: 12.7, 12.1, 12.0, 12.0, 11.8, 11.7, 11.6, 11.7, 11.6, 11 7. Make an inference about the potential under-reporting of the emissions data for this 10-day period.
Want to see the full answer?
Check out a sample textbook solution
Chapter 13 Solutions
Statistics for Business and Economics (13th Edition)


- Background: To prevent crashes caused by running red lights, many states are installing cameras at dangerous intersections. These cameras are used to take photographs of the license plates of vehicles that run a red light. The Virginia Department of Transportation (VDOT) obtained data on the number of crashes per year caused by running a red light at 13 intersections in Fairfax County, Virginia. Source: Virginia Transportation Research Council, "Research Report: The Impact of Red Light Cameras (Photo-Red Enforcement) on Crashes in Virginia", June 2007 Directions: Perform an appropriate significance test to determine whether or not the reduction in the number of crashes was statistically significant. RED LIGHT PHOTO ENFORCED 1. Click on the Data button below to display the data. Copy the data into a statistical software package and click the Data button a second time to hide it. Data Before After 3.5 1.46 0.47 0.1 0.39 0 4.55 1.69 2.6 2.04 2.39 3.14 2.5 2.62 0.83 0.14 3.25 1.57 3.41…arrow_forwardDetermine if the following scenarios involve an observational study or an experiment. Make sure your answers are legible and spelled correctly. A team of ecologists determines the different species of frogs that live in the local swamplands. A medical researcher divides patients into a treatment group and a control group to determine the effect of a new drug on overall cholesterol levels in patients. A medical insurance company determines the average cost to cover a tooth extraction procedure over the past 3 years. As part of a medical study to determine the effectiveness of a new technique for abdominal surgery, patients undergo the surgery with the new technique or with a traditional technique. The recovery time from surgery is then compared for the two different techniques. The general manager of a baseball team determines the on-base percentage (OBP) for his players over the past two seasons. A dietitian examined the effectiveness of a weight-loss program by randomly…arrow_forward. Primary Data Source and Secondary Data Source ?arrow_forward
- 2. Two types of instruments for measuring the amount of sulfur monoxide in the atmosphere are being compared in an air-pollution experiment. Researchers wish to determine whether the two types of instruments yield measurements having the same variability. The readings in the following table were recorded for the two instruments. Sulfur Monoxide Instrument A Instrument B 0.87 0.74 0.63 0,82 0.75 0.61 0.55 0,76 0,70 080 0.64 0.81 0,68 0,69 0.57 0,65 0,53arrow_forwardActivity Limitations. The National Center for Health Statistics compiles information on activity limitations. Results are published in Vital and Health Statistics. The data show that 13.6% of males and 14.4% of females have an activity limitation. Are gender and activity limitation statistically independent? Explain your answer.arrow_forward
 Linear Algebra: A Modern IntroductionAlgebraISBN:9781285463247Author:David PoolePublisher:Cengage Learning
 Glencoe Algebra 1, Student Edition, 9780079039897...AlgebraISBN:9780079039897Author:CarterPublisher:McGraw Hill
 Big Ideas Math A Bridge To Success Algebra 1: Stu...AlgebraISBN:9781680331141Author:HOUGHTON MIFFLIN HARCOURTPublisher:Houghton Mifflin Harcourt