
Concept explainers
Videos
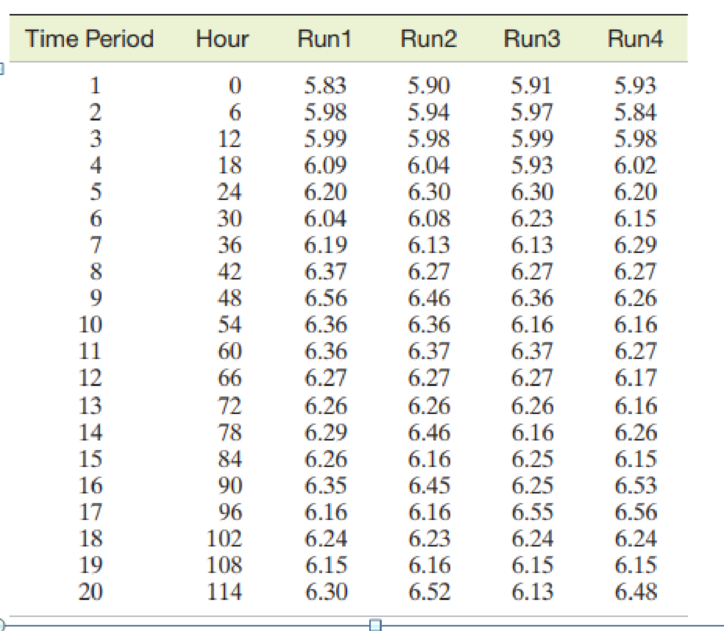
Bioreactor production of antibodies. Benchtop bioreactors are used to produce antibodies for anti-cancer drugs. Engineers calibrate bioreactors in order to maximize production. The African Journal of Biotechnology (December 2011) published a study designed to achieve a high percentage of antibody production from a bioreactor. The variable of interest was the natural logarithm of the number of viable cells produced in a bioreactor run. Data were collected for a sample of four bioreactor runs every 6 hours for 20 consecutive time periods. These data (simulated from information provided in the article) are listed in the accompanying table. Engineers have specified the following for the bioreactor runs: target mean = 6.3, LSL = 5.9, and USL = 6.5. Run a complete capability analysis on the data. How would you categorize the performance of the process?
Want to see the full answer?
Check out a sample textbook solution
Chapter 13 Solutions
Statistics for Business and Economics (13th Edition)


- Does a linear, exponential, or logarithmic model best fit the data in Table 2? Find the model.arrow_forwardIs carbon dating? Why does it work? Give an example in which carbon dating would be useful.arrow_forwardCONCEPT CHECK Determine whether each statement is true or false, and explain why. A correlation coefficient of zero indicates a perfect fit with the data.arrow_forward
- Turbid water is muddy or cloudy water. Sunlight is necessary for most life forms; thus turbid water is considered a threat to wetland ecosystems. Passive filtration systems are commonly used to reduce turbidity in wetlands. Suspended solids are measured in mg/l. Is there a relation between input and output turbidity for a passive filtration system and, if so, is it statistically significant? At a wetlands environment in Illinois, the inlet and outlet turbidity of a passive filtration system have been measured. A random sample of measurements are shown below. (Reference: EPA Wetland Case Studies.) Reading Inlet (mg/l) Outlet (mg/l) 3 4 5 6 7 8 9 10 11 12 31.6 86.9 87.0 12.0 45.4 43.3 32.3 77.7 71.7 85.9 64.9 80.1 3.3 14.2 16.8 5.7 4.6 6.2 3.4 7.7 8.0 7.4 8.7 14.3 Use a 1% level of significance to test the claim that there is a monotone relationship (either way) between the ranks of the inlet readings and outlet readings. (a) Rank-order the inlet readings using 1 as the largest data…arrow_forwardResearchers want to examine the following traits of a new medication: the half-life of the medication in the body, effectiveness of the medication in treating symptoms, and the rate of insomnia in users of the medication. Which of the variables require using a placebo during the tests? Select all that apply. A : Half-life of the medication in the body because knowing they are taking the medication will affect how fast a patient metabolizes the medication. B : Effectiveness of the medication in treating symptoms because knowing they are taking the medication will affect how patients report the effectiveness. C : Rate of insomnia in users of the medication because knowing they are taking the medication will affect how patients report insomnia.arrow_forwardTurbid water is muddy or cloudy water. Sunlight is necessary for most life forms; thus turbid water is considered a threat to wetland ecosystems. Passive filtration systems are commonly used to reduce turbidity in wetlands. Suspended solids are measured in mg/l. Is there a relation between input and output turbidity for a passive filtration system and, if so, is it statistically significant? At a wetlands environment in Illinois, the inlet and outlet turbidity of a passive filtration system have been measured. A random sample of measurements are shown below. (Reference: EPA Wetland Case Studies.) Use a 1% level of significance to test the claim that there is a monotone relationship (either way) between the ranks of the inlet readings and outlet readings. (a) Rank-order the inlet readings using 1 as the largest data value. Also rank-order the outlet readings using 1 as the largest data value. Then construct a table of ranks to be used for a Spearman rank correlation test. (c) Compute…arrow_forward
- Turbid water is muddy or cloudy water. Sunlight is necessary for most life forms; thus turbid water is considered a threat to wetland ecosystems. Passive filtration systems are commonly used to reduce turbidity in wetlands. Suspended solids are measured in mg/l. Is there a relation between input and output turbidity for a passive filtration system and, if so, is it statistically significant? At a wetlands environment in Illinois, the inlet and outlet turbidity of a passive filtration system have been measured. A random sample of measurements are shown below. (Reference: EPA Wetland Case Studies.) Reading 1 2 3 4 5 6 7 8 9 10 11 12 Inlet (mg/l) 59.1 25.7 70.5 71.0 37.6 43.5 13.1 24.2 16.7 49.1 67.6 31.7 Outlet (mg/l) 18.2 14.3 15.3 17.5 13.1 8.0 4.1 4.4 4.3 5.8 16.3 7.1 Use a 1% level of significance to test the claim that there is a monotone relationship (either way) between the ranks of the inlet readings and outlet readings. (a) Rank-order the inlet readings using 1 as…arrow_forwardTurbid water is muddy or cloudy water. Sunlight is necessary for most life forms; thus turbid water is considered a threat to wetland ecosystems. Passive filtration systems are commonly used to reduce turbidity in wetlands. Suspended solids are measured in mg/l. Is there a relation between input and output turbidity for a passive filtration system and, if so, is it statistically significant? At a wetlands environment in Illinois, the inlet and outlet turbidity of a passive filtration system have been measured. A random sample of measurements are shown below. (Reference: EPA Wetland Case Studies.) Reading 1 2 3 4 5 6 7 8 9 10 11 12 Inlet (mg/l) 62.1 13.8 63.5 30.6 91.1 11.5 67.2 75.6 79.3 29.5 72.9 21.3 Outlet (mg/l) 11.3 2.7 7.5 12.3 12.9 3.8 13.3 13.2 15.1 6.0 7.0 4.7 Use a 1% level of significance to test the claim that there is a monotone relationship (either way) between the ranks of the inlet readings and outlet readings. (a) Rank-order the inlet readings using 1 as…arrow_forwardAccording to a newspaper study of more than 1 million medical dispatches from 2007 to 2012, the 911 response time for medical aid varies dramatically across a city. Under national standards adopted by the city's fire department, rescuers are supposed to arrive within six minutes to almost all medical emergencies. But the newspaper analysis found that in affluent hillside communities of the city, firefighters failed to hit that mark nearly 85% of the time. The following data show the response times, in minutes, for 10 emergency calls in the Griffith Park neighborhood. 11.8 10.3 10.7 10.6 11.5 8.3 10.5 10.9 10.7 11.2 Based on this sample of ten response times, compute the descriptive statistics (in minutes) in parts (a) and (b) and then answer the questions in parts (c) and (d). (a) mean, median, and mode (in min) mean minmedian minmode min (b) range and standard deviation (in min) (Round your answers to four decimal places.) range minstandard deviation min (c) Compute…arrow_forward
- Heart rate during laughter. Laughter is often called “the best medicine,” since studies have shown that laughter can reduce muscle tension and increase oxygenation of the blood. In the International Journal of Obesity (Jan. 2007), researchers at Vanderbilt University investigated the physiological changes that accompany laughter. Ninety subjects (18–34 years old) watched film clips designed to evoke laughter. During the laughing period, the researchers measured the heart rate (beats per minute) of each subject, with the following summary results: Mean = 73.5, Standard Deviation = 6. n=90 (we can treat this as a large sample and use z) It is well known that the mean resting heart rate of adults is 71 beats per minute. Based on the research on laughter and heart rate, we would expect subjects to have a higher heart beat rate while laughing.Construct 95% Confidence interval using z value. What is the lower bound of CI? a) Calculate the value of the test statistic.(z*) b) If…arrow_forwardExplain the Logistic Modeling of Population Data?arrow_forwardA GLM was used to estimate the expected losses per customer across gender and driver type. There are two categories for driver type: Commute and Leisure. The log link function was used, and Male and Commute were the base levels for Gender and Driver type, respectively. There are no interaction terms in the model. The GLM produced the following predicted values for expected loss per customer: Commute Leisure Male 4.52 4.5 Female 33 181 Calculate the estimated B for the Gender variable. О а. 3.4 O b. 1.7 О с. 2.0 O d. 1.5 О е. 3.0arrow_forward
 Linear Algebra: A Modern IntroductionAlgebraISBN:9781285463247Author:David PoolePublisher:Cengage Learning
 Calculus For The Life SciencesCalculusISBN:9780321964038Author:GREENWELL, Raymond N., RITCHEY, Nathan P., Lial, Margaret L.Publisher:Pearson Addison Wesley,
 Glencoe Algebra 1, Student Edition, 9780079039897...AlgebraISBN:9780079039897Author:CarterPublisher:McGraw Hill
 Big Ideas Math A Bridge To Success Algebra 1: Stu...AlgebraISBN:9781680331141Author:HOUGHTON MIFFLIN HARCOURTPublisher:Houghton Mifflin Harcourt