
Statistics for Business and Economics (13th Edition)
13th Edition
ISBN: 9780134506593
Author: James T. McClave, P. George Benson, Terry Sincich
Publisher: PEARSON
expand_more
expand_more
format_list_bulleted
Videos
Textbook Question
Chapter 13.5, Problem 13.33ACI
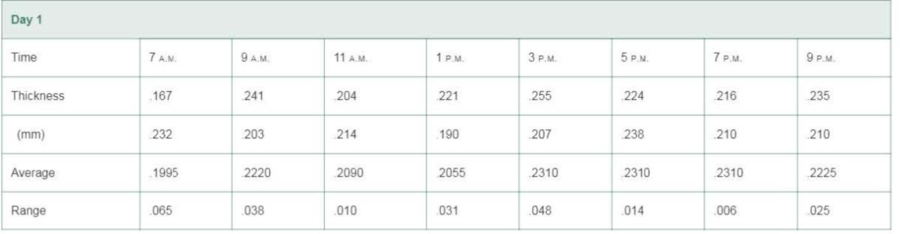
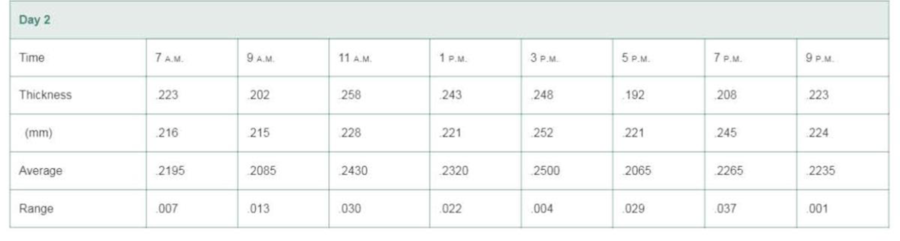
Lowering the thickness of an expensive blow-molded container. Quality (March 2009) presented a problem that actually occurred at a plant that produces a high-volume, blow-molded container with multiple layers. One of the layers is very expensive to manufacture. The quality manager at the plant desires to lower the average thickness for the expensive layer of material and still meet specifications. To estimate the actual thickness for this layer, the manager measured the thickness for one container from each of two cavities every 2 hours for 2 consecutive days. The data (in millimeters) are shown in the following tables.
- a. Construct an R -chart for the data.
- b. Construct an
- c. Based on the control charts in parts a and b, comment on the current behavior of the manufacturing process. As part of your answer, give an estimate of the true average thickness of the expensive layer.
Expert Solution & Answer
Want to see the full answer?
Check out a sample textbook solution
Students have asked these similar questions
A farmer has recently acquired a 110 hectares piece of land. He has decided to grow Wheat and barley on that land. Due to the quality of the sun and the region’s excellent climate, the entire production of Wheat and Barley can be sold. He wants to know how to plant each variety in the 110 hectares, given the costs, net profits and labor requirements according to the data shown below:
Variety
Wheat
Cost (price/hec)
100
Net Profit (Price/hec)
50
Man-days/Hecs
10
Barley
200
120
30
The farmer has a budget of US$10,000 and an availability of 1,200 man-days during the planning horizon. In addition, the farmer would like to get a profit of at least $3000. Generate the mathematical model for the optimal usage of land area to produce wheat and barley. Using graphical method to optimize land usage, how many hectares are to be used for wheat and barley.
A farmer has recently acquired a 110 hectares piece of land. He has decided to grow
Wheat and barley on that land. Due to the quality of the sun and the region's
excellent climate, the entire production of Wheat and Barley can be sold. He wants
to know how to plant each variety in the 110 hectares, given the costs, net profits and
labor requirements according to the data shown below:
Variety
Cost (Price/Hec)
Net Profit (Price/Hec)
Man-days/Hec
Wheat
100
50
10
Barley
200
120
30
The farmer has a budget of US$10,000 and an availability of 1,200 man-days during
the planning horizon. In addition, the farmer would like to get a profit of at least $3000.
Generate the mathematical model for the optimal usage of land area to produce
wheat and barley. Using graphical method to optimize land usage, how many
hectares are to be used for wheat and barley.
An environmental engineer wants to evaluate three different methods for disposing of nonhazardous chemical waste: land application,
fluidized-bed incineration, and private disposal contract. Use the estimates below to help her determine which has the least cost at /=
15.00% per year on the basis of an annual worth evaluation.
First Cost
AOC per Year
Salvage Value
Life
Land
$-145000
$-86000
$23000
4 years
Incineration
$-760000
$-70000
$260000
6 years
Contract
O
$-132000
O
2 years
Chapter 13 Solutions
Statistics for Business and Economics (13th Edition)
Ch. 13.4 - What is a control chart? Describe its use.Ch. 13.4 - Explain why rational subgrouping should be used in...Ch. 13.4 - When a control chart is first constructed, why are...Ch. 13.4 - Which process parameter is an x -chart used to...Ch. 13.4 - Even if all the points on an x -chart fall between...Ch. 13.4 - What must be true about the variation of a process...Ch. 13.4 - Use the six pattern-analysis rules described in...Ch. 13.4 - Consider the x -chart shown below. a. Is the...Ch. 13.4 - Use Table IX on page 13-74 to find the value of A2...Ch. 13.4 - Twenty-five consecutive samples of size n = 5 were...
Ch. 13.4 - The data in the following table were collected for...Ch. 13.4 - Prob. 13.12ACBCh. 13.4 - Active pharmaceutical ingredient. During the...Ch. 13.4 - Detecting gender-related employment disparities....Ch. 13.4 - Pain levels of ICU patients. Various interventions...Ch. 13.4 - Quality control for irrigation data. Most farmers...Ch. 13.4 - Improving public health waiting times. Statistical...Ch. 13.4 - Cereal box manufacturing. A machine at K-Company...Ch. 13.4 - Detecting under-reported emissions. The...Ch. 13.4 - 13 20 Selecting the best wafer-slicing machine....Ch. 13.4 - Chunky data. BPI Consulting, a leading provider of...Ch. 13.4 - Military aircraft bolts. A precision parts...Ch. 13.5 - What characteristic of a process is an R-chart...Ch. 13.5 - Prob. 13.24LMCh. 13.5 - Use Table IX on page 13-74 to find the values of...Ch. 13.5 - Construct and interpret an R-chart for the data in...Ch. 13.5 - Construct and interpret an R-chart for the data in...Ch. 13.5 - Construct and interpret an R-chart and an x -chart...Ch. 13.5 - Weight of packed frozen scallops. In Quality...Ch. 13.5 - Detecting gender-related employment disparities....Ch. 13.5 - Pain levels of ICU patients. Refer to the Research...Ch. 13.5 - Quality control for irrigation data. Refer to...Ch. 13.5 - Lowering the thickness of an expensive blow-molded...Ch. 13.5 - Cola bottle filling process. A soft-drink bottling...Ch. 13.5 - Chunky data. Refer to Exercise 13.21e (p. 13-40)...Ch. 13.5 - Replacement times for lost ATM cards. In an effort...Ch. 13.5 - Military aircraft bolts. Refer to the...Ch. 13.5 - Precision of scale weight measurements. The...Ch. 13.6 - What characteristic of a process is a p-chart...Ch. 13.6 - In each of the following cases, use the sample...Ch. 13.6 - The proportion of defective items generated by a...Ch. 13.6 - To construct a p-chart for a manufacturing...Ch. 13.6 - To construct a p-chart, 20 samples of size 150...Ch. 13.6 - Academic failure rates in Nigeria. The quality...Ch. 13.6 - Monitoring surgery complications. An article on...Ch. 13.6 - Rental car call center study. A worldwide rental...Ch. 13.6 - Defective micron chips. A manufacturer produces...Ch. 13.6 - Hand break cable defects. In Control Engineering...Ch. 13.6 - Monitoring newspaper typesetters. Accurate...Ch. 13.6 - Quality of rewritable CDs. A Japanese compact disc...Ch. 13.6 - Leaky process pumps. Quality (February 2008)...Ch. 13.6 - Rubber company lire tests. Goodstone Tire Rubber...Ch. 13.7 - Explain why it is inappropriate to conduct a...Ch. 13.7 - Explain the difference between process spread and...Ch. 13.7 - Describe two different ways to assess the...Ch. 13.7 - Why is it recommended to use and interpret Cp in...Ch. 13.7 - For a process that is in control and follows a...Ch. 13.7 - Find the specification spread for each of the...Ch. 13.7 - Find (or estimate) the process spread for each of...Ch. 13.7 - Find the value of Cp for each of the following...Ch. 13.7 - Upper specification limit of a process. An...Ch. 13.7 - Capability of an in-control process. A process is...Ch. 13.7 - Water use at a thermal power plant. Thermal power...Ch. 13.7 - Cereal box filling process. Refer to the data on...Ch. 13.7 - Military aircraft bolts. Refer to Exercise 13.22...Ch. 13.7 - Bioreactor production of antibodies. Benchtop...Ch. 13.7 - Driver gear bore holes. During the manufacture of...Ch. 13.7 - Lowering the thickness of an expensive blow-molded...Ch. 13 - Define quality and list its important dimensions.Ch. 13 - What is a process? Give an example of an...Ch. 13 - What is a system? Give an example of a system with...Ch. 13 - Describe the six major sources of process...Ch. 13 - Suppose all the output of a process over the last...Ch. 13 - Processes that are in control are predictable;...Ch. 13 - Compare and contrast special and common causes...Ch. 13 - Explain the difference between control limits and...Ch. 13 - Should control charts be used to monitor a process...Ch. 13 - Under what circumstances is it appropriate to use...Ch. 13 - A process is under control and follows a normal...Ch. 13 - Weight of a product. Consider the time series data...Ch. 13 - Lengths of pencils. The length measurements of 20...Ch. 13 - Applying pattern-analysis rules. Use the...Ch. 13 - Defective plastic mold. A company that...Ch. 13 - Robotics clamp gap width. Control chart...Ch. 13 - Package sorting time. AirExpress. an overnight...Ch. 13 - Waiting times of airline passengers. Officials at...Ch. 13 - Defects in graphite shafts. Over the last year, a...Ch. 13 - New iron-making process. Mining Engineering...Ch. 13 - CPU of a computer chip. The central processing...Ch. 13 - Bayfield Mud Company case. The text Quantitative...
Knowledge Booster


Learn more about
Need a deep-dive on the concept behind this application? Look no further. Learn more about this topic, statistics and related others by exploring similar questions and additional content below.Similar questions
- If the cost of each Robust tablet increases to 75 c and the cost of each Vigortab increases to 80 c , find the minimum cost.arrow_forwardSuppose that a firm can produce a part it uses for $520 per unit, with a fixed cost of $25,000. The company has been offered a contract from a supplier that allows it to purchase the part at a cost of $544 per unit, which includes transportation. The key outputs in the model are the difference in these costs and the decision that results in the lower cost. Assume that the production volume is uncertain. Suppose the manufacturer has enough data and information to estimate that the production volume will be normally distributed with a mean of 1,000 and a standard deviation of 85. Use a 100-trial Monte Carlo simulation to find the average cost difference and percent of trials that result in manufacturing or outsourcing as the best decision. Please include table showing both the cost difference and decision for each trial. Please include the Excel worksheet with all the details with your answer.arrow_forwardParent W requires one of component B and two of component C. Both B and Care run on work center 10. Setup time for B is 2 hours, and run time is 0.1 hour perpiece. For component C, setup time is 2 hours, and run time is 0.15 hour per piece. Ifthe rated capacity of the work center is 80 hours, how many Ws should be producedin a week?arrow_forward
- A farmer has recently acquired a 110 hectares piece of land. He has decided to grow Wheat and barley on that land. Due to the quality of the sun and the region’s excellent climate, the entire production of Wheat and Barley can be sold. He wants to know how to plant each variety in the 110 hectares, given the costs, net profits, and labor requirements according to the data shown below: Variety Cost (Price/Hec) Net Profit (Price/Hec) Man-days/Hec Wheat 100 50 10 Barley 200 120 30 The farmer has a budget of US$10,000 and an availability of 1,200 man-days during the planning horizon. Find the optimal solution and the optimal value.arrow_forward2.) Consider an M/M/2 system with an arrival rate of 9 per minute and a service rate of 8 per minute. What is the average time a customer spends in the system? Take your answer to three decimal places. Omit the units in your answer.arrow_forwardThe principle of redundancy is used when system reliability is improved through redundant or backup components. Assume that a student's alarm clock has a 8.2% daily failure rate. Complete parts (a) through (d) below.arrow_forward
- As humans we consume food. The body extracts good things such as proteins and vitamins and throws away waste. A typical waste product is a uric acid. High levels of uric acid can be an indication of conditions such as gout, kidney disease, and cancer. For females a high level of uric acid is 6 mg/dL or more and for males a high level of uric acid is 7 mg/dL or more. Suppose, over a period of months, an adult female has taken 8 blood test for uric acid. The results of the test are shown below. results 8.9 6.27 3.99 7.42 9.94 8.99 9.17 5.65 Find a 95% confidence interval for the population mean of uric acid in this adult female's blood. (Round your answers to two decimal places.)margin of error mg/dL lower limit mg/dL upper limit mg/dL Does this confidence interval suggest that this adult female has a high level of uric acid? Explain your answer.arrow_forwardArsenic is a naturally occurring chemical that can enter groundwater through eroding granite or from a burned forest. A health organization recommends drinking water should contain no more than 10 parts per billion (ppb) of arsenic. A company produces filters to clean arsenic from private wells that could be affected by the groundwater. The company wants to investigate the effectiveness of a new filter compared to that of an older filter. They will test the filters on a field that is bordered on one side by a granite ledge and on the other side by a burned forest. The field is divided into 88 square plots of equal size, and a well to collect groundwater is drilled in the center of each plot. One filter will be used in each well. The following diagram shows the placement of the wells in the field. The company will use four of each type of filter to conduct the investigation. A randomized block design will be used. (a) Assuming there is a difference in the effectiveness of the two…arrow_forwardSolar energy generation along highways. The potential of using solar panels constructed above national highways to generate energy was explored in the International Journal of Energy and Environmental Engineering (December 2013). Two-layer solar panels (with 1 meter separating the panels) were constructed above sections of both east-west and north-south highways in India. The amount of (kilowatt-hours) supplied to the country's grid by the solar panels above the two types of highways was determined each month. The data for several randomly selected months are provided in the table. The researchers concluded that the "two-layer solar panel energy generation is more viable for the north-south oriented highways as compared to east- west oriented roadways." Compare the mean solar energy amounts generated for the two types of highways using a 95% confidence interval. Does the interval support the re- energy searchers' conclusion? Month East-West North-South February April July September…arrow_forward
- 3) Two suppliers are bidding for a customer's business. Both are similar in cost, percentage of on-time deliveries, etc. The final decision will be based on which supplier provides the "best" quality. The process outputs for suppliers A and B are displayed below. Supplier A's process has half the variation as B's, but is centered halfway between the middle of the tolerance and the USL, with 0.1% above the USL. Supplier B, on the other hand, is centered exactly at the middle of the tolerance, with 0.1% of its output outside each of the two specifications. Other estimates: SD (A): 0.809 SD (B): 1.618 Supplier A 52.5 Supplier B Supplier A has 0.5% 0.5% defects 0.25% 0.25% Supplier B has 0.25 % defective both sides LSL-45 50 USL-56 Questions 3||3a) What is the Cp of Supplier A? 4||3b)What is the Cp of Supplier B? 5||3c) What is the Cpk of supplier A? 6||3d) What is the Cpk of Supplier b? 7||3e) Who should get the bid award? 8||3f) Per 1000 products, how many good products has Supplier A…arrow_forwardGood morning. Can you answer the question of the second stage equipment and measurements material, engineering, and within 5 minutes, with many thanks and appreciationarrow_forwardBruno Fruscalzo decided to start a small production facility in Sydney to sell gelato to the local restaurants. His local milk supplier charges $0.5 per kg of milk plus a $15 delivery fee (that is independent of the amount ordered). Bruno's holding cost is $0.03 per kg per month. He needs 9250 kgs of milk per month. a. Suppose Bruno orders 9750 kgs each time. What is his average inventory (kgs)? (Round your answer to 1 decimal place.) b. Suppose Bruno orders 6250 kgs each time. How many orders does he place with his supplier each year? C. How many kgs should Bruno order from his supplier with each order to minimize the sum of ordering and holding costs? (Do not round intermediate calculations. Round your answer to 2 decimal places.) If Bruno's storage vessel can hold only 2000 kgs of milk, what would be Bruno's annual ordering and holding costs? (Do not round intermediate calculations. Round your answer to 2 decimal places.) If Bruno's storage vessel can hold only 5750 kgs of milk,…arrow_forward
arrow_back_ios
SEE MORE QUESTIONS
arrow_forward_ios
Recommended textbooks for you
 College Algebra (MindTap Course List)AlgebraISBN:9781305652231Author:R. David Gustafson, Jeff HughesPublisher:Cengage Learning
College Algebra (MindTap Course List)
Algebra
ISBN:9781305652231
Author:R. David Gustafson, Jeff Hughes
Publisher:Cengage Learning
Solve ANY Optimization Problem in 5 Steps w/ Examples. What are they and How do you solve them?; Author: Ace Tutors;https://www.youtube.com/watch?v=BfOSKc_sncg;License: Standard YouTube License, CC-BY
Types of solution in LPP|Basic|Multiple solution|Unbounded|Infeasible|GTU|Special case of LP problem; Author: Mechanical Engineering Management;https://www.youtube.com/watch?v=F-D2WICq8Sk;License: Standard YouTube License, CC-BY
Optimization Problems in Calculus; Author: Professor Dave Explains;https://www.youtube.com/watch?v=q1U6AmIa_uQ;License: Standard YouTube License, CC-BY
Introduction to Optimization; Author: Math with Dr. Claire;https://www.youtube.com/watch?v=YLzgYm2tN8E;License: Standard YouTube License, CC-BY