Financial & Managerial Accounting
14th Edition
ISBN: 9781337119207
Author: Carl Warren, James M. Reeve, Jonathan Duchac
Publisher: Cengage Learning
expand_more
expand_more
format_list_bulleted
Videos
Textbook Question
Chapter 20, Problem 3ADM
Apple Inc.: Segment revenue analysis
Segment disclosure by Apple Inc. provides sales information for its major product lines for three recent years as follows (in millions):
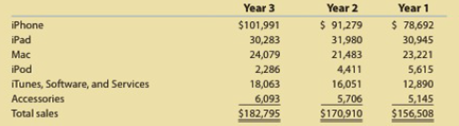
- A. Which product had the greatest percentage of Year 3 sales? Which product had the least percentage of Year 3 sales? (Round to nearest whole percent.)
- B. Which product grew the most in sales, in percentage terms, using Year 1 as the base year? (Round to nearest whole percent.)
Expert Solution & Answer

Trending nowThis is a popular solution!

Students have asked these similar questions
Adams Company reported the following operating results for two consecutive years:
Required
Compute each income statement component for each of the two years as a percent of sales.
Note: Percentages may not add exactly due to rounding. Round your answers to 1 decimal place. (i.e., .234 should be entered as
23.4).
Sales
Cost of goods sold
Gross margin on sales
Operating expenses
Income before taxes
Income taxes
Net income
ADAMS COMPANY
Vertical Analysis of Income Statements
Year 4
Percentage of
Sales for Year 4
100.0
%
$
$
X Answer is not complete.
999,500
549,725
449,775
129,400
320,375
81,000
239,375
%
$
$
Year 3
1,081,500
598,400
483,100
152,000
331,100
80,400
250,700
Percentage of
Sales for Year 3
100.0 %
%
1. Prepare a comparative income statement for the two-year period, presenting an analysis of each item in relationship to sales for each of the years. Round to one decimal place. Enter all amounts as positive numbers.
Fielder Industries Inc.
Comparative Income Statement
For the Years Ended December 31, 20Y2 and 20Y1
20Y2 Amount
20Y2 Percent
20Y1 Amount
20Y1 Percent
Sales
$1,300,000
fill in the blank bcf5f3fbd02f054_1%
$1,180,000
fill in the blank bcf5f3fbd02f054_2%
Cost of goods sold
682,500
fill in the blank bcf5f3fbd02f054_3%
613,600
fill in the blank bcf5f3fbd02f054_4%
Gross profit
$617,500
fill in the blank bcf5f3fbd02f054_5%
$566,400
fill in the blank bcf5f3fbd02f054_6%
Selling expenses
$260,000
fill in the blank bcf5f3fbd02f054_7%
$188,800
fill in the blank bcf5f3fbd02f054_8%
Administrative expenses
169,000
fill in the blank bcf5f3fbd02f054_9%
177,000
fill in the blank bcf5f3fbd02f054_10%
Total operating expenses
$429,000
fill in the blank…
Assume the following sales data for a company:Current year$832,402 Preceding year608,082What is the percentage increase in sales from the preceding year to the current year?
a.136.89%
b.36.89%
c.73.05%
d.26.95%
The relationship of $242,729 to $104,267, expressed as a ratio, is
a.0.8
b.2.3
c.0.4
d.0.7
Chapter 20 Solutions
Financial & Managerial Accounting
Ch. 20 - What types of costs are customarily included in...Ch. 20 - Which type of manufacturing cost (direct...Ch. 20 - Which of the following costs would be included in...Ch. 20 - In the variable costing income statement, how are...Ch. 20 - Since all costs of operating a business are...Ch. 20 - Discuss how financial data prepared on the basis...Ch. 20 - Why might management analyze product...Ch. 20 - Explain why rewarding sales personnel on the basis...Ch. 20 - Discuss the two factors affecting both sales and...Ch. 20 - How is the quantity factor for an increase or a...
Ch. 20 - Explain why service companies use different...Ch. 20 - Variable costing Marley Company has the following...Ch. 20 - Variable costingproduction exceeds sales Fixed...Ch. 20 - Variable costing sales exceed production The...Ch. 20 - Analyzing income under absorption and variable...Ch. 20 - Contribution margin by segment The following...Ch. 20 - Contribution margin analysis The actual variable...Ch. 20 - Inventory valuation under absorption costing and...Ch. 20 - Income statements under absorption costing and...Ch. 20 - Income statements under absorption costing and...Ch. 20 - Cost of goods manufactured, using variable costing...Ch. 20 - Variable costing income statement On November 30,...Ch. 20 - Absorption costing income statement On March 31....Ch. 20 - Variable costing income statement The following...Ch. 20 - Estimated income statements, using absorption and...Ch. 20 - Variable and absorption costing Ansara Company had...Ch. 20 - Prob. 20.10EXCh. 20 - Prob. 20.11EXCh. 20 - Product profitability analysis Power Train Sports...Ch. 20 - Territory and product profitability analysis Coast...Ch. 20 - Sales territory and salesperson profitability...Ch. 20 - Segment profitability analysis The marketing...Ch. 20 - Prob. 20.16EXCh. 20 - Contribution margin analysis sales Select Audio...Ch. 20 - Prob. 20.18EXCh. 20 - Contribution margin analysis variable costs Based...Ch. 20 - Variable costing income statement for a service...Ch. 20 - Contribution margin reporting and analysis for a...Ch. 20 - Variable costing income statement and contribution...Ch. 20 - Absorption and variable costing income statements...Ch. 20 - Income statements under absorption costing and...Ch. 20 - Absorption and variable costing income statements...Ch. 20 - Salespersons' report and analysis Walthman...Ch. 20 - Segment variable costing income statement and...Ch. 20 - Contribution margin analysis Farr Industries Inc....Ch. 20 - Prob. 20.1BPRCh. 20 - Income statements under absorption costing and...Ch. 20 - Absorption and variable costing income statements...Ch. 20 - Salespersons' report and analysis Pachec Inc....Ch. 20 - Variable costing income statement and effect on...Ch. 20 - Contribution margin analysis Mathews Company...Ch. 20 - Prob. 1ADMCh. 20 - Prob. 2ADMCh. 20 - Apple Inc.: Segment revenue analysis Segment...Ch. 20 - LVMH: Group segment sales and EBITDA analysis LVMH...Ch. 20 - Prob. 20.1TIFCh. 20 - Communication Bon Jager Inc. manufactures and...
Knowledge Booster


Learn more about
Need a deep-dive on the concept behind this application? Look no further. Learn more about this topic, accounting and related others by exploring similar questions and additional content below.Similar questions
- Juroe Company provided the following income statement for last year: Juroes balance sheet as of December 31 last year showed total liabilities of 10,250,000, total equity of 6,150,000, and total assets of 16,400,000. Required: 1. Calculate the return on sales. (Note: Round the percent to two decimal places.) 2. CONCEPTUAL CONNECTION Briefly explain the meaning of the return on sales ratio, and comment on whether Juroes return on sales ratio appears appropriate.arrow_forwardVertical analysis (common-size) percentages for Baker Company’s sales revenue, cost of goods sold, and expenses are as follows. Did Baker’s net income as a percent of sales increase, decrease, or remain unchanged over the 3-year period? Provide numerical support for your answer. Vertical Analysis 2018 2017 2016 Sales revenue 100.0% 100.0% 100.0% Cost of goods sold 60.0 63.9 65.0 Expenses 26.0 26.6 27.5arrow_forwardVertical analysis of income statement Revenue and expense data for Innovation Quarter Inc. for two recent years are as follows: A. Prepare an income statement in comparative form, stating eachitem for both years as a percent of sales. (Round to the nearestwhole percentage.)B. Comment on the significant changes disclosed by thecomparative income statement.arrow_forward
- b. The vertical analysis indicates that the cost of goods sold as a percent of sales by 8 percentage points, while selling expenses - by 4 percentage points, and administrative expenses by 1 percentage points. Thus, net income as a percent of sales by 3 percentage points.arrow_forwardVertical Analysis of Income Statement Revenue and expense data for Innovation Quarter Inc. for two recent years are as follows: Current Year Previous Year Sales Cost of merchandise sold Selling expenses Administrative expenses Income tax expense Sales a. Prepare an income statement in comparative form, stating each item for both years as a percent of sales. If required, round percentages to one decimal place. Enter all amounts as positive numbers. Innovation Quarter Inc. Comparative Income Statement For the Years Ended December 31 Current year Amount Current year Percent $388,000 100 248,320 Cost of merchandise sold Gross profit Selling expenses Administrative expenses Total operating expenses Income from operations Income tax expense $388,000 248,320 54,320 62,080 7,760 Net income $353,000 208,270 56,480 52,950 14,120 $ 54,320 62,080 7,760 % % % % % % % % % Previous year Amount Previous year Percent $353,000 100 ✓ % 208,270 $ 56,480 52,950 14,120 % % % % % % % %arrow_forwardVertical Analysis of Income Statement Revenue and expense data for Innovation Quarter Inc. for two recent years are as follows: Current Year Previous Year Sales $457,000 $407,000 Cost of goods sold 283,340 231,990 Selling expenses 68,550 69,190 Administrative expenses 77,690 65,120 Income tax expense 9,140 16,280 a. Prepare an income statement in comparative form, stating each item for both years as a percent of sales. If required, round percentages to one decimal place. Enter all amounts as positive numbers. Innovation Quarter Inc. Comparative Income Statement For the Years Ended December 31 Current year Amount Current year Percent Previous year Amount Previous year Percent Sales $457,000 % $407,000 % Cost of goods sold 283,340 231,990 % % % Selling expenses 68,550 % 69,190 Administrative expenses 77,690 % 65,120 % % % % % Income tax expense 9,140 % 16,280 % % % b. The vertical analysis indicates that the cost of goods sold as a percent of sales by 5 percentage points, while selling…arrow_forward
- Vertical Analysis of Income Statement Revenue and expense data for Innovation Quarter Inc. for two recent years are as follows: Previous Year Sales Cost of goods sold Selling expenses Administrative expenses Income tax expense Current Year $447,000 272,670 71,520 71,520 13,410 $384,000 215,040 69,120 57,600 15,360arrow_forward1. Prepare a comparative income statement with horizontal analysis for the two-year period, using 20Y2 as the base year. Enter decreases as negative amounts and negative percentages. Round percentage chang to one decimal place. Greyhound Technology Company Comparative Income Statement For the Years Ended December 31, 20Y3 and 20Y2 Increase (Decrease) Increase (Decrease) 20Y3 20Y2 Amount Percent Sales $636,292 5541,000 Cost of goods sold (462,400) (340,000) Gross profit $173,892 $201,000 Seling expenses S(66,700) s(46,000) Administratve expenses (38,400) (29,000) Total operating expenses $(105,100) $(75,000) Income from operations $68,792 $126,000 Other income 2,880 2,300 Income before income tax $71,672 $128,300 Income tax expense (20,100) (38,500) Net income $51,572 S89,800arrow_forwardAssume the following sales data for a company: Current year $861,289 Preceding year 512,943 What is the percentage increase in sales from the preceding year to the current year? a.67.91% b.59.56% c.40.44% d.167.91%arrow_forward
- Horizontal Analysis of Income Statement For 20Y2, McDade Company reported a decline in net income. At the end of the year, T. Burrows, the president, is presented with the following condensed comparative income statement: McDade Company Comparative Income Statement For the Years Ended December 31, 20Y2 and 20Y1 20Υ2 20Υ1 Sales $829,639 $693,000 Cost of merchandise sold 616,000 440,000 Gross profit $213,639 $253,000 Selling expenses $87,000 $58,000 Administrative expenses 50,320 37,000 Total operating expenses $137,320 $95,000 Income from operations $76,319 $158,000 Other revenue 3,634 2,900 Income before income tax expense $79,953 $160,900 Income tax expense 22,400 48,300 Net income $57,553 $112,600 Required:arrow_forwardAssume the following sales data for a company: Line Item Description Amount Current year $891,303 Preceding year 515,759 What is the percentage increase in sales from the preceding year to the current year?arrow_forward1. Prepare a comparative income statement with horizontal analysis for the two-year period, using 20Y2 as the base year. Enter decreeses as negative amounts and negative percentages. Round percentage changes to one decimal place. Greyhound Technology Company Comparative Income Statement For the Years Ended December 31, 20Y3 and 20Y2 Increase (Decrease) Increase (Decrease) Amount 20Υ3 20Y2 Percent Sales $739,806 $646,000 S Cost of goods sold (533,000) (410,000) Gross profit $206,806 $236,000 Seling expenses $(74,250) $(54,000) Administrative expenses (43,180) 4,00) Total operating expenses 117,430) $(88,000) Income from operations $89.376 $148.000 3,351 2,700 Other income Income before income tax $92,727 $150,700 S (26,000) (45,200) Income tax expense $66,727 S105,500 Net incomearrow_forward
arrow_back_ios
SEE MORE QUESTIONS
arrow_forward_ios
Recommended textbooks for you
 Financial & Managerial AccountingAccountingISBN:9781337119207Author:Carl Warren, James M. Reeve, Jonathan DuchacPublisher:Cengage Learning
 Managerial Accounting: The Cornerstone of Busines...AccountingISBN:9781337115773Author:Maryanne M. Mowen, Don R. Hansen, Dan L. HeitgerPublisher:Cengage Learning
 Managerial AccountingAccountingISBN:9781337912020Author:Carl Warren, Ph.d. Cma William B. TaylerPublisher:South-Western College Pub
 Financial AccountingAccountingISBN:9781305088436Author:Carl Warren, Jim Reeve, Jonathan DuchacPublisher:Cengage Learning
 Financial AccountingAccountingISBN:9781337272124Author:Carl Warren, James M. Reeve, Jonathan DuchacPublisher:Cengage Learning
Financial & Managerial Accounting
Accounting
ISBN:9781337119207
Author:Carl Warren, James M. Reeve, Jonathan Duchac
Publisher:Cengage Learning
Managerial Accounting: The Cornerstone of Busines...
Accounting
ISBN:9781337115773
Author:Maryanne M. Mowen, Don R. Hansen, Dan L. Heitger
Publisher:Cengage Learning
Managerial Accounting
Accounting
ISBN:9781337912020
Author:Carl Warren, Ph.d. Cma William B. Tayler
Publisher:South-Western College Pub
Financial Accounting
Accounting
ISBN:9781305088436
Author:Carl Warren, Jim Reeve, Jonathan Duchac
Publisher:Cengage Learning
Financial Accounting
Accounting
ISBN:9781337272124
Author:Carl Warren, James M. Reeve, Jonathan Duchac
Publisher:Cengage Learning
How To Analyze an Income Statement; Author: Daniel Pronk;https://www.youtube.com/watch?v=uVHGgSXtQmE;License: Standard Youtube License