Financial & Managerial Accounting
14th Edition
ISBN: 9781337119207
Author: Carl Warren, James M. Reeve, Jonathan Duchac
Publisher: Cengage Learning
expand_more
expand_more
format_list_bulleted
Concept explainers
Videos
Textbook Question
Chapter 20, Problem 4ADM
LVMH: Group segment sales and EBITDA analysis
LVMH Group is a French domiciled company known for Dior, Givenchy, Louis Vuitton, and many other fashion brands. LVMH's operating segment revenues, operating income, and
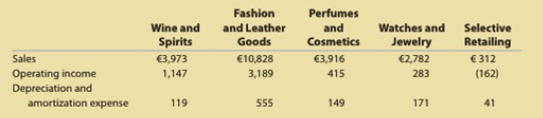
- A. Prepare a vertical analysis of the segment sales to total sales. (Round to nearest whole percent.)
- B. Interpret the vertical analysis in (A).
- C. Compute (1) EBITDA and (2) EBITDA as a percent of sales (EBITDA margin) for each segment. (Round to nearest whole percent.)
- D. Prepare a column bar chart of the EBITDA as a percent of sales for the segments in descending order.
- E. Interpret the chart in (D).
Expert Solution & Answer
Want to see the full answer?
Check out a sample textbook solution
Students have asked these similar questions
Analyze Yum! Brands by segment
Yum! Brands, Inc. (YUM) is a worldwide operator and franchisor of fast-food restaurants, under the familiar brands of KFC, Pizza Hut, and Taco
Bell. Segment revenues, operating income, and depreciation and amortization expense for Yum!'s operating segments are provided for a recent
year as follows (in millions):
Depreciation and
Sales
Operating Income
Segment
Amortization Expense
$3,232
$874
$173
KFC
Pizza Hut
1,111
370
36
Taco Bell
2,025
593
91
a. Prepare a vertical analysis of the sales as a percent of total sales for the three segments. Round percentages to the nearest whole
percent.
Segment
Percentage of Total
Revenue
КFC
Pizza Hut
Taco Bell
$
Total
Which segment has the greatest percentage of total sales?
A condensed income statement for Northeast Airlines and a partially completed vertical analysis are
presented below.
ts
Required:
1. Complete the vertical analysis by computing each missing line item as a percentage of sales revenues.
(Round your answers to the nearest whole percent.)
еВook
Print
NORTHEAST AIRLINES
Income Statement (summarized)
For the Year Ended December 31
eferences
(in millions of U.S. dollars)
2016
2015
Sales Revenues
$ 20,925
100
$ 20,320
100 %
Salaries and Wages Expense
6,823
33
6,408
Fuel, Oil, Repairs, and Maintenance
4,717
4,646
Other Operating Expenses
5,200
4,725
23
Other Expenses (Revenues)
238
1
652
Income before Income Tax Expense
3,947
19
3,889
19
Income Tax Expense
Net Income
1,370
7
1,361
7
$ 2,577
% $ 2,528
%
中
Starship Corporation reported the following geographical segment revenues for a recent and a prior fiscal year:
Recent Year(in millions, rounded)
Prior Year(in millions, rounded)
Americas
$10,479
$8,073
EMEA*
1,217
1,295
China/Asia Pacific
2,396
1,130
Channel Development**
1,731
1,546
Other
2,236
1,695
Total
$18,059
$13,739
*Europe, Middle East, and Africa
**Sells packaged coffee and teas globally
a. Prepare a horizontal analysis of the segment data using the prior year as the base year. Round all percents to one decimal place. Enter all amounts in millions. If required, use minus sign to indicate the decreasing values.
Starship Corporation
Horizontal Analysis
Recent Year (in millions)
Prior Year (in millions)
Increase (Decrease)Amount
Increase (Decrease)Percent
Americas
$10,479
$8,073
$fill in the blank 15396ff9101df9f_1
fill in the blank 15396ff9101df9f_2%
EMEA
1,217
1,295
fill in the blank 15396ff9101df9f_3
fill…
Chapter 20 Solutions
Financial & Managerial Accounting
Ch. 20 - What types of costs are customarily included in...Ch. 20 - Which type of manufacturing cost (direct...Ch. 20 - Which of the following costs would be included in...Ch. 20 - In the variable costing income statement, how are...Ch. 20 - Since all costs of operating a business are...Ch. 20 - Discuss how financial data prepared on the basis...Ch. 20 - Why might management analyze product...Ch. 20 - Explain why rewarding sales personnel on the basis...Ch. 20 - Discuss the two factors affecting both sales and...Ch. 20 - How is the quantity factor for an increase or a...
Ch. 20 - Explain why service companies use different...Ch. 20 - Variable costing Marley Company has the following...Ch. 20 - Variable costingproduction exceeds sales Fixed...Ch. 20 - Variable costing sales exceed production The...Ch. 20 - Analyzing income under absorption and variable...Ch. 20 - Contribution margin by segment The following...Ch. 20 - Contribution margin analysis The actual variable...Ch. 20 - Inventory valuation under absorption costing and...Ch. 20 - Income statements under absorption costing and...Ch. 20 - Income statements under absorption costing and...Ch. 20 - Cost of goods manufactured, using variable costing...Ch. 20 - Variable costing income statement On November 30,...Ch. 20 - Absorption costing income statement On March 31....Ch. 20 - Variable costing income statement The following...Ch. 20 - Estimated income statements, using absorption and...Ch. 20 - Variable and absorption costing Ansara Company had...Ch. 20 - Prob. 20.10EXCh. 20 - Prob. 20.11EXCh. 20 - Product profitability analysis Power Train Sports...Ch. 20 - Territory and product profitability analysis Coast...Ch. 20 - Sales territory and salesperson profitability...Ch. 20 - Segment profitability analysis The marketing...Ch. 20 - Prob. 20.16EXCh. 20 - Contribution margin analysis sales Select Audio...Ch. 20 - Prob. 20.18EXCh. 20 - Contribution margin analysis variable costs Based...Ch. 20 - Variable costing income statement for a service...Ch. 20 - Contribution margin reporting and analysis for a...Ch. 20 - Variable costing income statement and contribution...Ch. 20 - Absorption and variable costing income statements...Ch. 20 - Income statements under absorption costing and...Ch. 20 - Absorption and variable costing income statements...Ch. 20 - Salespersons' report and analysis Walthman...Ch. 20 - Segment variable costing income statement and...Ch. 20 - Contribution margin analysis Farr Industries Inc....Ch. 20 - Prob. 20.1BPRCh. 20 - Income statements under absorption costing and...Ch. 20 - Absorption and variable costing income statements...Ch. 20 - Salespersons' report and analysis Pachec Inc....Ch. 20 - Variable costing income statement and effect on...Ch. 20 - Contribution margin analysis Mathews Company...Ch. 20 - Prob. 1ADMCh. 20 - Prob. 2ADMCh. 20 - Apple Inc.: Segment revenue analysis Segment...Ch. 20 - LVMH: Group segment sales and EBITDA analysis LVMH...Ch. 20 - Prob. 20.1TIFCh. 20 - Communication Bon Jager Inc. manufactures and...
Knowledge Booster


Learn more about
Need a deep-dive on the concept behind this application? Look no further. Learn more about this topic, accounting and related others by exploring similar questions and additional content below.Similar questions
- Excel Online Structured Activity: Balance Sheet Analysis Consider the following financial data for J. White Industries: Total assets turnover: 1.2Gross profit margin on sales: (Sales - Cost of goods sold)/Sales = 27%Total liabilities-to-assets ratio: 45%Quick ratio: 0.90Days sales outstanding (based on 365-day year): 29.5 daysInventory turnover ratio: 4.0 The data has been collected in the Microsoft Excel Online file below. Open the spreadsheet and perform the required analysis to answer the questions below. Open spreadsheet Complete the balance sheet and sales information in the table that follows for J. White Industries. Do not round intermediate calculations. Round your answers to the nearest whole dollar. Partial Income StatementInformation Sales $ fill in the blank 2 Cost of goods sold $ fill in the blank 3 Balance Sheet Cash $ fill in the blank 4 Accounts payable $ fill in the blank 5 Accounts receivable $ fill in the blank 6 Long-term debt $…arrow_forwardGiven the income statement below, Mega Trade Inc. wants to find the resulting net income for the year 2018 (in million). What is the right amount? Income Statement ($ Million) YEAR END YEAR END YEAR END YEAR END 2015 2016 2017 2018 Sales 1,234.90 1,251.70 1,300.40 1,334.40 Cost Sales -679.1 -659 -681.3 -667 Gross Operating Income Selling & Administration -339.7 -348.6 -351.2 -373.3 Depreciation -47.5 -52 -55.9 -75.2 Other Income/Expenses 11.8 7.6 7 8.2 Earnings Before Interest and Taxes Interest Income 1.3 1.4 1.7 2 Interest Expense -16.2 -15.1 -20.5 -23.7 Pre Tax Income Income Taxes -56.8 -64.2 -67.5 -72.6 Net Income Dividends -38.3 -38.7 -39.8 -40.1 Addition to Retained Earningsarrow_forwardBenchmark analysis: Trademark Corp.'s financial manager collected the following information for its peer group to compare its performance against that of its peers. Ratios Trademark Peer Group DSO 33.5 days 27.9 days Total assets turnover 2.3 3.7 Inventory turnover 1.8 2.8 Quick ratio 0.6 1.3 (a) Explain how Trademark is performing relative to its peers. (b) How do the industry ratios help Trademark's management?arrow_forward
- Vertical analysis (common-size) percentages for Cullumber Company’s sales revenue, cost of goods sold, and expenses are listed here. Vertical Analysis 2022 2021 2020 Sales revenue 100.0 % 100.0 % 100.0 % Cost of goods sold 60.0 64.2 65.6 Expenses 24.7 27.1 29.5 Calculate Cullumber’s net income as a percent of sales. (Round answers to 1 decimal place, e.g. 5.2.) 2022 2021 2020 Net income Enter percentages rounded to 1 decimal place. Enter percentages rounded to 1 decimal place. Enter percentages rounded to 1 decimal place. Did Cullumber’s net income as a percent of sales increase, decrease, or remain unchanged over the 3-year period? Cullumber’s net income as a percent of sales Choose the correct answer increaseddecreasedremained unchangedarrow_forwardAssume that you are purchasing an investment and have decided to invest in a company in the digital phone business. You have narrowed the choice to Digitized Corp. and Very Network, Inc. and have assembled the following data. LOADING... (Click to view the income statement data.) Data Table Selected income statement data for the current year: Digitized Very Network Net Sales Revenue (all on credit) $418,290 $494,940 Cost of Goods Sold 210,000 256,000 Interest Expense 0 15,000 Net Income 62,000 70,000 (Click to view the balance sheet and market price data.) Data Table Selected balance sheet and market price data at the end of the current year: Digitized Very Network Current Assets: Cash $24,000 $21,000 Short-term Investments 42,000 19,000 Accounts Receivables, Net 36,000 46,000 Merchandise Inventory 67,000 98,000 Prepaid Expenses 22,000 18,000 Total…arrow_forwardPayton Company has the following segment revenues for the two most recent fiscal years. Segment Current Year (in millions) Prior Year (in millions) China $770 $650 Canada 326 240 Other countries 212 168 Total revenues $1,308 $1,058 Prepare a vertical analysis of the segment data. Calculate the percentage to four decimal places, then round your answer to one decimal place. Payton Company Vertical Analysis Current Year Prior Year Current Year Percent Prior Year Segment Amount Amount Percent (in millions) (in millions) China $770 $650 % Canada 326 240 Other countries 212 168 Total revenues $1,308 $1,058 Previous Nextarrow_forward
- Game-On Sports operates in two distinct segments: athletic equipment and accessories. The income statement for each operating segment is presented below.Required:1. Complete the "%" columns to be used in a vertical analysis of Game-On Sports’ two operating segments. Express each amount as a percentage of sales. (Round your percentage answers to 1 decimal place.) GAME-ON SPORTS Income Statement For the Year Ended December 31, 2021 Athletic Equipment Accessories Amount % Amount % Net sales $2,800,000 $3,250,000 Cost of goods sold 1,250,000 1,620,000 Gross profit 1,550,000 1,630,000 Operating expenses 650,000 700,000 Operating income 900,000 930,000 Other income (expense) 75,000 (10,000) Income before tax 975,000 920,000 Income tax expense 225,000 200,000 Net income $750,000 $720,000 2. Use vertical analysis to compare the profitability of the two operating segments. Which segment is more…arrow_forwardStarbucks Corporation reported the following geographical segment revenues for a recent and a prior fiscal year: Recent Year Prior Year (in millions, rounded) (in millions, rounded) Americas $13,293 $11,980 EMEA* 1,217 1,295 China/Asia Pacific 2,396 1,130 Channel Development** 1,731 1,546 Other 526 497 $19,163 $16448 Total *Europe, Middle East, and Africa **Sells packaged coffee and teas globally a. Prepare a horizontal analysis of the segment data using the prior year as the base year. Round whole percents to one decimal place. b. Prepare a vertical analysis of the segment data. Round whole percents to one decimal place. c. What conclusions can be drawn from your analyses?arrow_forwardBalance Sheet Analysis Complete the balance sheet and sales information in the table that follows for J. White Industries using the following financial data: Total assets turnover: 1.3Gross profit margin on sales: (Sales - Cost of goods sold)/Sales = 20%Total liabilities-to-assets ratio: 45%Quick ratio: 0.90Days' sales outstanding (based on 365-day year): 36.5 daysInventory turnover ratio: 3.50 Do not round intermediate calculations. Round your answers to the nearest whole dollar. Partial Income Statement Information Sales? Cost of goods sold? Balance Sheetarrow_forward
- ces Required: a. Firm D has net income of $91,936, sales of $1,436,500, and average total assets of $845,000. Calculate the firm's margin, turnover, and ROI. b. Firm E has fet income of $174,195, sales of $2,205,000, and ROI of 11.85%. Calculate the firm's turnover and average total assets. c. Firm F has ROI of 15.80%, average total assets of $1,880,000, and turnover of 0.8. Calculate the firm's sales, margin, and net income. Complete this question by entering your answers in the tabs below. Required A Required B Required C Firm E has net income of $174,195, sales of $2,205,000, and ROI of 11.85%. Calculate the firm's turnover and average total assets. Note: Do not round intermediate calculations. Round "Turnover" answer to 1 decimal place. Turnover Average total assetsarrow_forwardSegment analysis for a service company Charles Schwab Corporation (SCHW) is one of the more innovative brokerage and financial service companies in the United States. The company recently provided information about its major business segments as follows (in millions): InvestorServices AdvisorServices Revenues $5,411 $2,067 Operating income 2,031 962 Depreciation 180 54 a. The Investor Services segment serves the retail customer, you and me. These are the brokerage, Internet, and mutual fund services used by individual Investors. The Advisor Services segment includes the same services provided for financial institutions, such as banks, mutual fund managers, insurance companies, and pension plan administrators. b. Indicate whether the following costs are a “Variable Cost” or a “Fixed Cost” in the “Investor Services” segment. 1. Commissions to brokers Variable Cost 2. Fees paid to exchanges for executing trades Variable Cost 3. Depreciation on brokerage…arrow_forwardGiven the income statement below, Mega Trade Inc. wants to find the resulting net income for the year 2016 (in million). What is the right amount? Income Statement ($ Million) YEAR END YEAR END YEAR END YEAR END 2015 2016 2017 2018 Sales 1,234.90 1,251.70 1,300.40 1,334.40 Cost Sales -679.1 -659 -681.3 -667 Gross Operating Income Selling & Administration -339.7 -348.6 -351.2 -373.3 Depreciation -47.5 -52 -55.9 -75.2 Other Income/Expenses 11.8 7.6 7 8.2 Earnings Before Interest and Taxes Interest Income 1.3 1.4 1.7 2 Interest Expense -16.2 -15.1 -20.5 -23.7 Pre Tax Income Income Taxes -56.8 -64.2 -67.5 -72.6 Net Income Dividends -38.3 -38.7 -39.8 -40.1arrow_forward
arrow_back_ios
SEE MORE QUESTIONS
arrow_forward_ios
Recommended textbooks for you
 Financial & Managerial AccountingAccountingISBN:9781337119207Author:Carl Warren, James M. Reeve, Jonathan DuchacPublisher:Cengage Learning
 Managerial AccountingAccountingISBN:9781337912020Author:Carl Warren, Ph.d. Cma William B. TaylerPublisher:South-Western College Pub
 Financial And Managerial AccountingAccountingISBN:9781337902663Author:WARREN, Carl S.Publisher:Cengage Learning,
 Financial AccountingAccountingISBN:9781337272124Author:Carl Warren, James M. Reeve, Jonathan DuchacPublisher:Cengage Learning
 Financial AccountingAccountingISBN:9781305088436Author:Carl Warren, Jim Reeve, Jonathan DuchacPublisher:Cengage Learning
Financial & Managerial Accounting
Accounting
ISBN:9781337119207
Author:Carl Warren, James M. Reeve, Jonathan Duchac
Publisher:Cengage Learning
Managerial Accounting
Accounting
ISBN:9781337912020
Author:Carl Warren, Ph.d. Cma William B. Tayler
Publisher:South-Western College Pub
Financial And Managerial Accounting
Accounting
ISBN:9781337902663
Author:WARREN, Carl S.
Publisher:Cengage Learning,
Financial Accounting
Accounting
ISBN:9781337272124
Author:Carl Warren, James M. Reeve, Jonathan Duchac
Publisher:Cengage Learning
Financial Accounting
Accounting
ISBN:9781305088436
Author:Carl Warren, Jim Reeve, Jonathan Duchac
Publisher:Cengage Learning
Foreign Exchange Risks; Author: Kaplan UK;https://www.youtube.com/watch?v=ne1dYl3WifM;License: Standard Youtube License